
By उलादज़िमिर लेउचानकोउSignal2Forex के संस्थापक · 11 नवंबर 2026
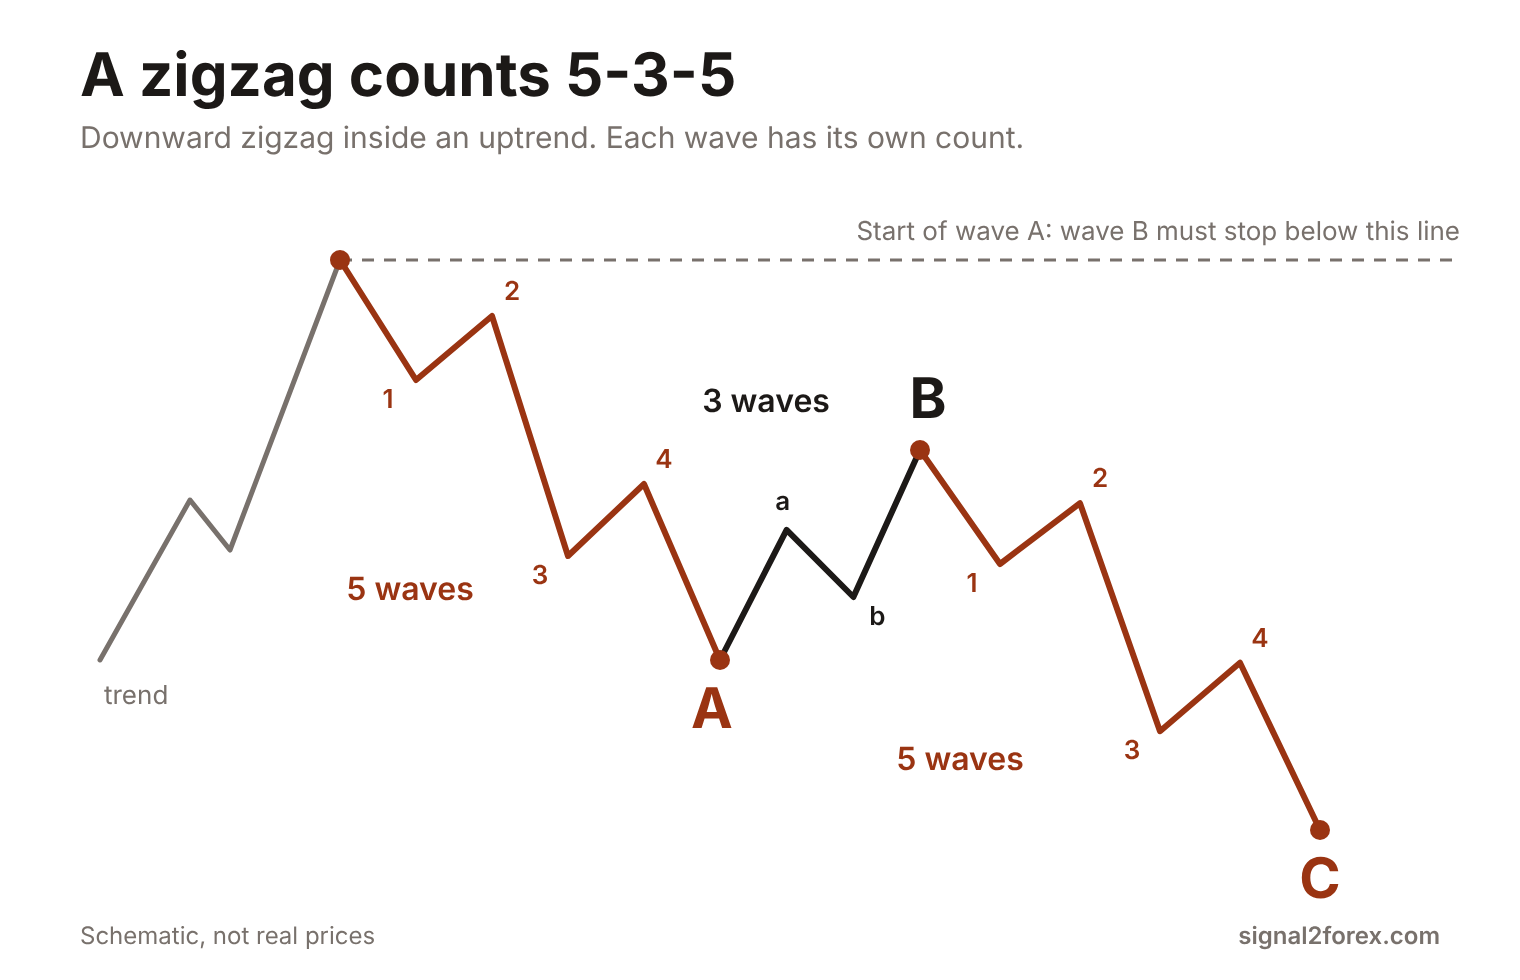
What is a zigzag in Elliott wave theory? A sharp move against the trend in three waves, labelled A, B and C. I suppose that is an answer too. But for me the zigzag Elliott wave is a count before it is a shape — five waves, three waves, five waves, written 5-3-5 — plus one hard rule. Wave B never passes the start of wave A.
A zigzag is a correction. It moves against the larger trend, so in a rising market it points down and in a falling market it points up. When the last wave ends, the old trend is expected to continue. This is why traders look for it — the end of wave C is a place to join the trend again.
There are other corrections in three waves, and they are easy to mix up. The table puts the zigzag next to its two closest relatives.
| पैटर्न | गिनती | तरंग बी |
|---|---|---|
| वक्र | 5-3-5 | Stops well before the start of wave A |
| फ्लैट | 3-3-5 | Returns to the start of wave A or close to it |
| Double zigzag | Two zigzags, W-X-Y | Each zigzag keeps its own wave B rule |
The zigzag Elliott wave pattern
The zigzag Elliott wave pattern has three parts, and each part has its own count. Wave A is a move against the trend in five waves. Then comes wave B — a move back in three waves, always smaller than wave A. Wave C has five waves again and goes in the same direction as wave A.
This is the 5-3-5 structure. Ralph Nelson Elliott described it in The Wave Principle in 1938, and Frost and Prechter kept the same count in their book Elliott Wave Principle. The numbers matter more than the look of the chart. Two moves can look the same from far away — and only one of them is a zigzag.
Where does a zigzag wave appear? Most often in wave two of a trend, where the market gives back a large part of wave one. It also appears as wave B inside a bigger correction, and as one side of a triangle. In wave four I see it less often — wave four usually moves sideways.
A zigzag wave pattern is fast. It covers a lot of price in a short time, and this is how you first notice it. If a correction is slow and goes sideways for days, I look for another count.
Two rules, several guidelines
Rules and guidelines are different things in Elliott wave analysis. A rule cannot be broken — if it breaks, the count is wrong. A guideline only tells you what happens most of the time.
The first rule — wave B must not go beyond the start of wave A. The second — wave A and wave C must each have five waves, and wave B must have three. Is that all? Yes, the list is short. A count that passes both rules is still only a candidate, and the market does not have to agree with it.
The guidelines are softer. Wave B often takes back between 38% and 79% of wave A. Wave C almost always ends beyond the end of wave A. When it fails to do so, Elliott books call it a truncation. It is the same idea as a truncated wave 5 in a trend — the last move in five waves stops before the previous extreme, and this tells you the move is weak.
If a guideline is broken, you need to check the count again. If a rule is broken, you need to drop it.
A live count on gold
I do not like examples from old charts where the answer is already known. So here is one that is still open as I write, on 11 November 2026. The numbers are rounded daily highs and lows of spot gold — your broker feed can differ by a few dollars.
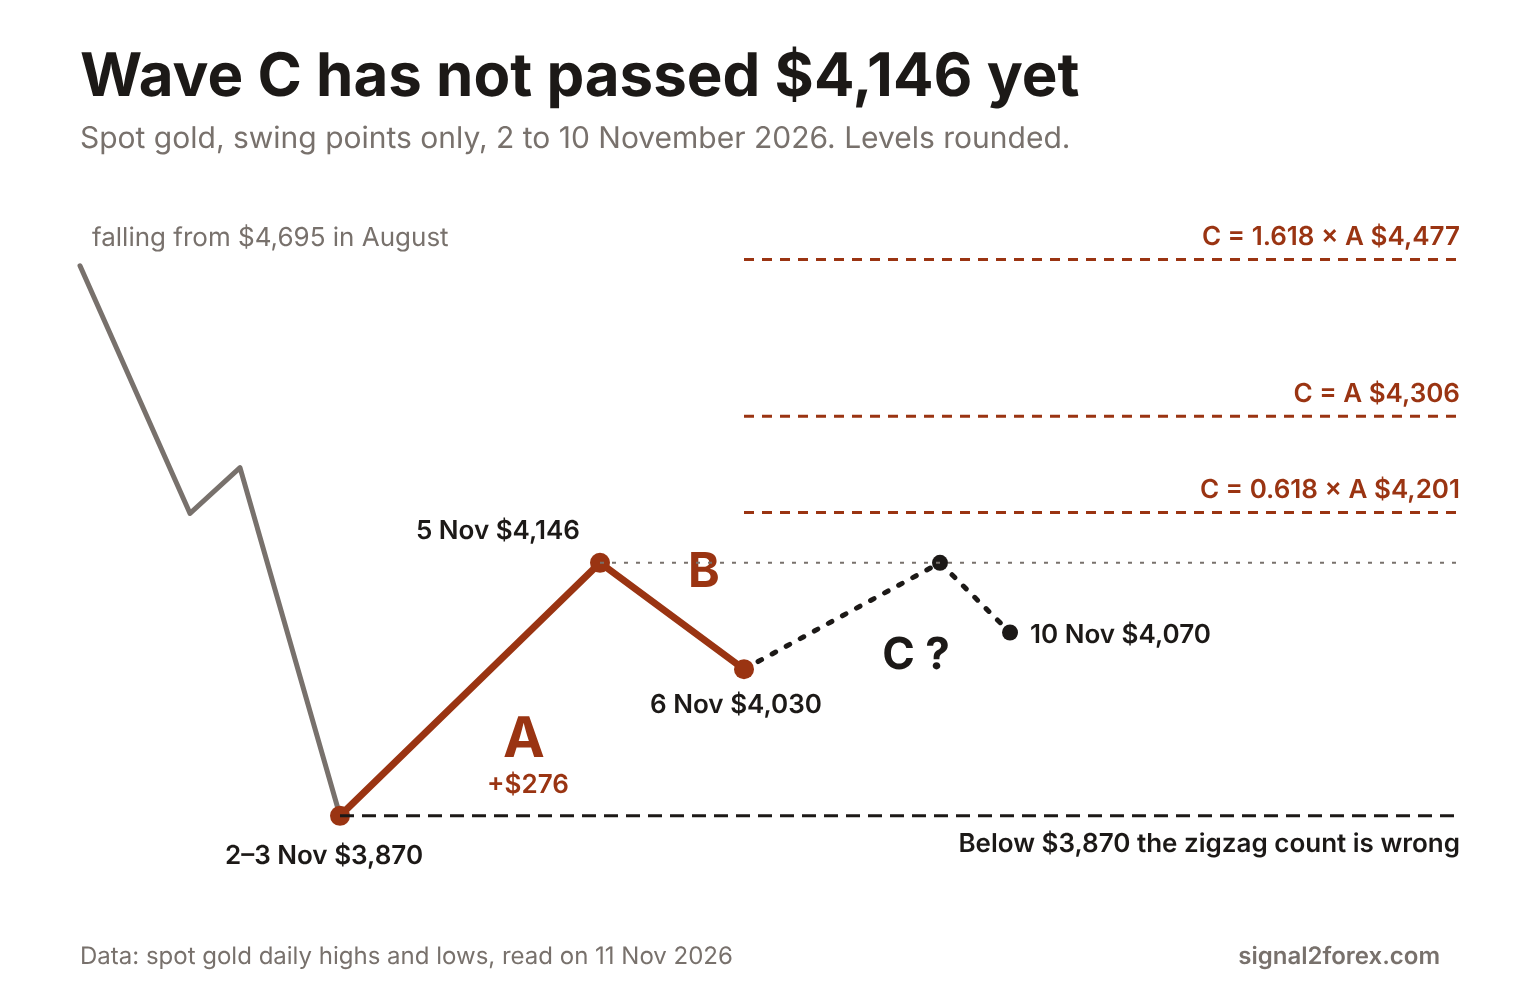
Gold has been falling since a high near $4,695 in August. At the start of November it made a low near $3,870. By 5 November it was at about $4,146 — a rise of $276 in three trading days. On 6 November it fell to about $4,030. On 10 November it tested $4,146 again and dropped back to about $4,070.
How do I count it? The rise from $3,870 to $4,146 is a candidate for wave A. The fall to $4,030 is a candidate for wave B — it took back $116, or 42% of wave A, so the rule about wave B holds. Wave C has not passed $4,146 yet. Until it does, this is an Elliott wave zigzag pattern that is not finished.
In money the size of wave A is easy to see. On one standard lot of gold — 100 ounces — a move of $276 is $27,600. On 0.01 lot it is $276, and on a cent account with the same 0.01 setting it is about $2.76. This is the same arithmetic as on my page about पाइप मूल्य.
I do not know whether wave C will arrive. If gold falls below $3,870 first, the rule is broken and there was no zigzag — only a pause in the downtrend. A count is finished when the chart finishes it.
Targets for wave C
There is one more thing traders want from a zigzag — a target. The usual method is to measure wave A and add it to the end of wave B.
The first target — wave C equal to wave A. For gold that is $4,030 plus $276, or $4,306. The second — wave C at 0.618 of wave A, which gives $4,030 plus $171, or $4,201. The third — wave C at 1.618 of wave A, which gives $4,477. Glenn Neely, in Mastering Elliott Wave, uses the name elongated zigzag for the case where wave C is much longer than wave A.
Some traders add a channel. You draw a line from the start of wave A to the end of wave B, and a parallel line through the end of wave A. Wave C often stops near that parallel line. It is the same tool I describe on the page about ट्रेंडलाइन विश्लेषण.
So which target do you choose? Most articles call the equal target the most reliable one. I do not agree with the word reliable. Three targets spread over $276 are a map of places to watch, and I would not place an order only because price reached one of them. For me a target becomes useful when it meets something else on the chart — an old high, a round number, the channel line.
Zigzag against flat
The zigzag is most often confused with the flat. Both have waves A, B and C. The difference is in the count and in wave B.
A flat is a 3-3-5 correction. Its wave A has only three waves, and its wave B goes back to the start of wave A or even past it. In a zigzag wave B stops far from that line. So when you see the 3-3-5 Elliott wave count, you need to expect a sideways move, and when you see 5-3-5, a deep one.
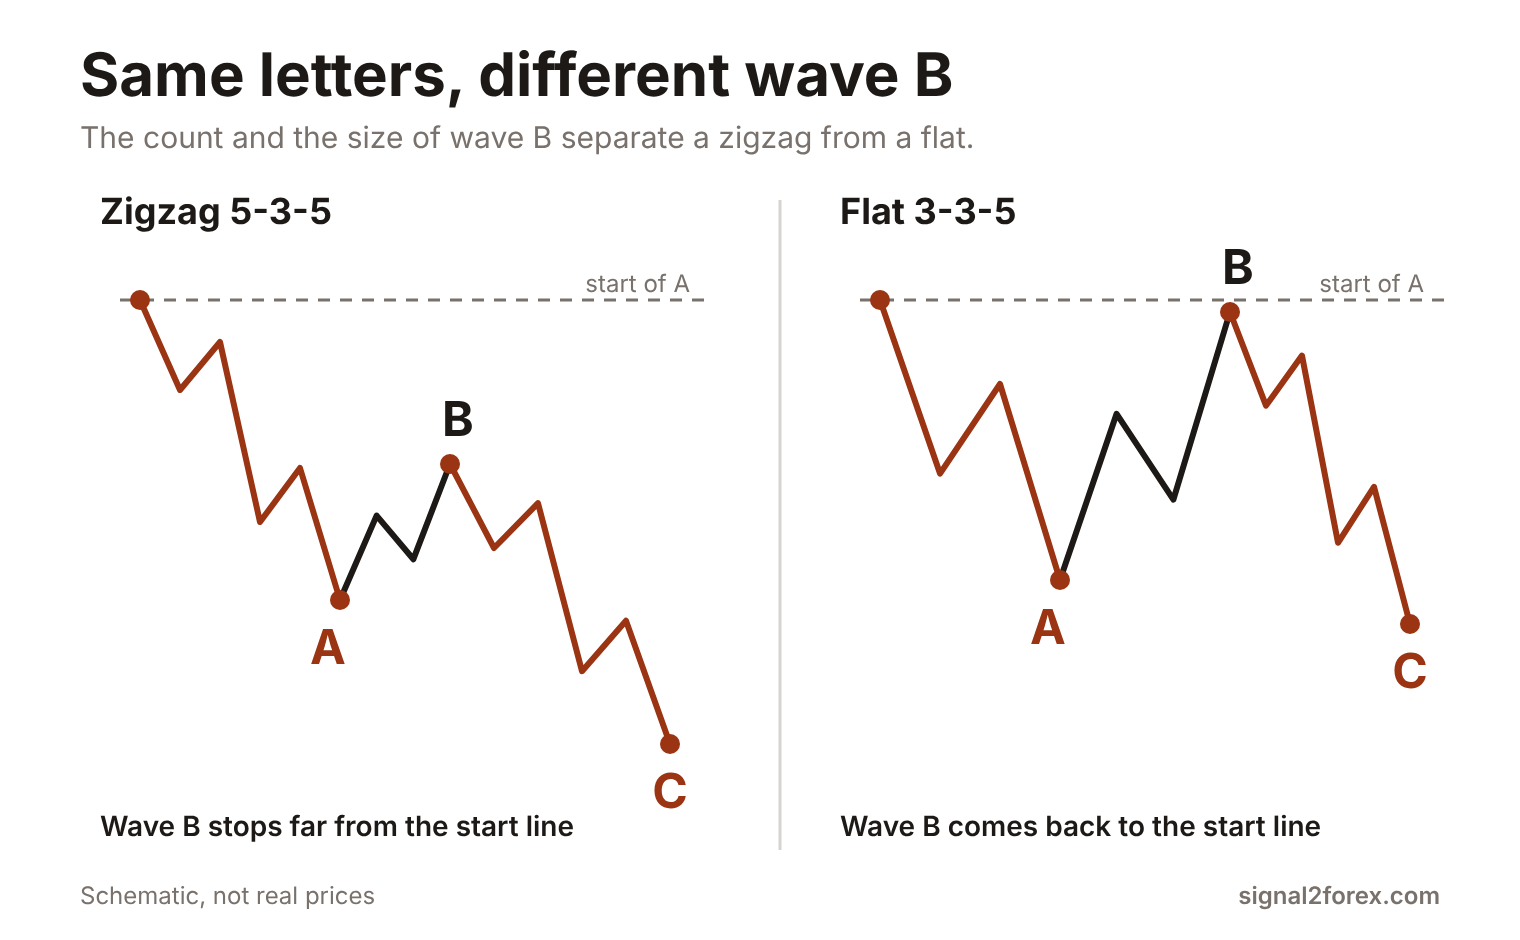
Why does it matter? Because the two patterns end in different places. A zig zag correction usually ends well beyond the end of wave A. A flat usually ends close to it. If you mix them up, your target for wave C is wrong from the start.
Double and triple zigzags
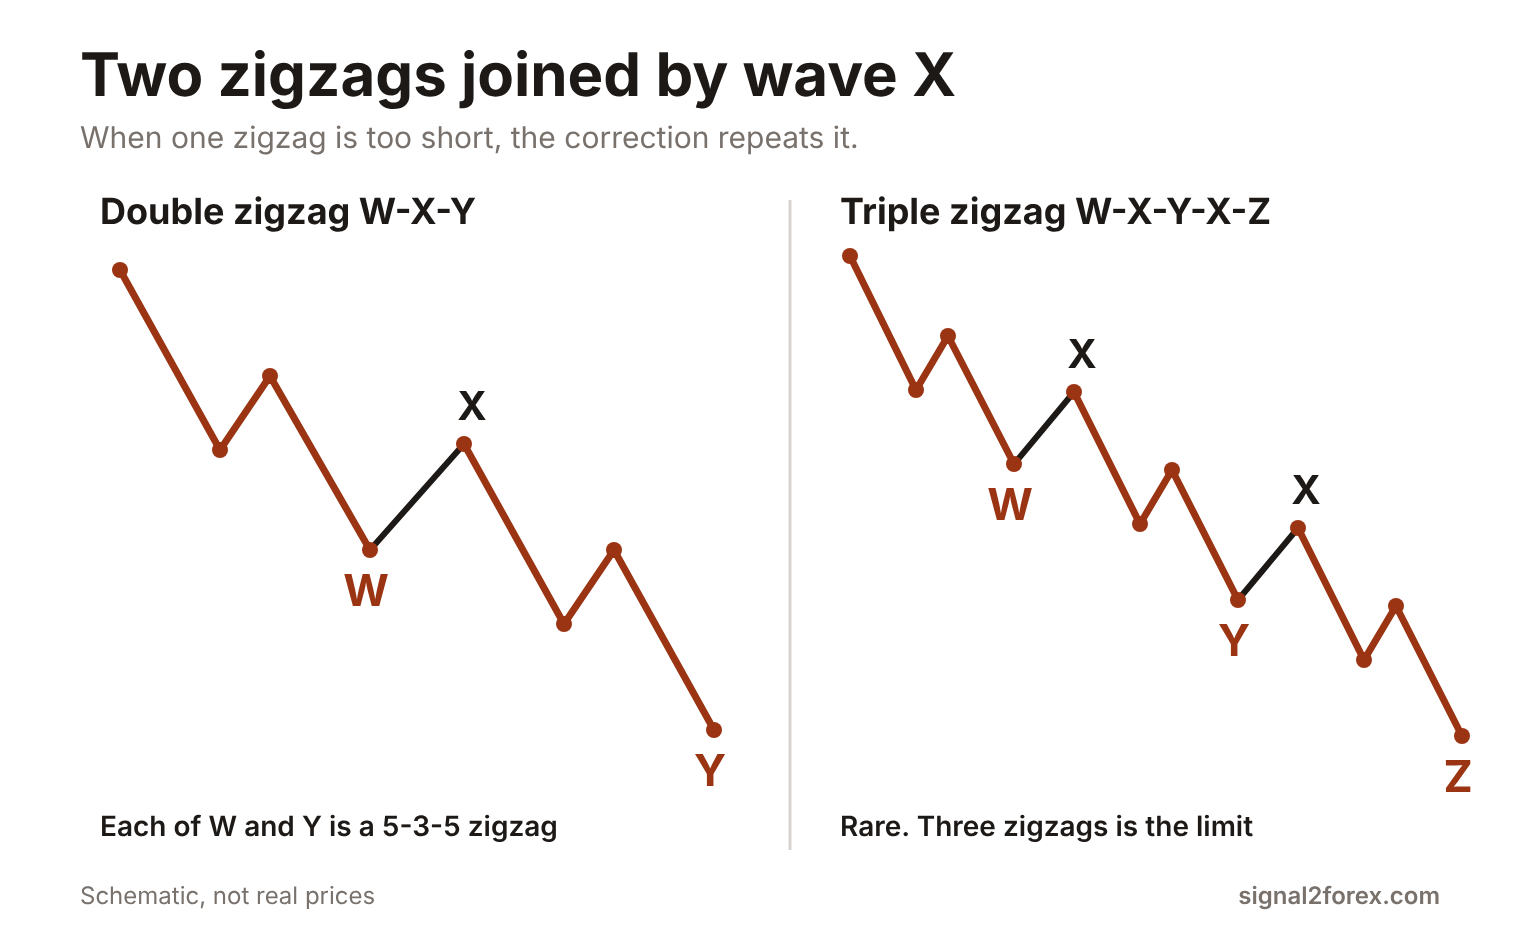
Sometimes one zigzag is not enough to finish the correction. Price makes a first zigzag, pauses in a small move of three waves, and then makes a second zigzag in the same direction. This is the double zigzag pattern.
The labels change here. The first zigzag is wave W, the pause is wave X, and the second zigzag is wave Y. So an Elliott wave double zigzag is written W-X-Y. A double zigzag correction is deeper than a single one. It often appears when the first zigzag was too short to reach a normal target.
A triple zigzag adds one more pause and one more zigzag — W-X-Y-X-Z, which some charts shorten to the WXYXZ pattern. It is rare. In Elliott Wave Principle Frost and Prechter write that three zigzags in a row is the limit, and I have nothing to add to that.
The gold count above can also end this way. If wave C stops near $4,201 and price only pauses there, a second zigzag may follow, and the double zigzag Elliott wave count becomes the working one. This is one more reason why I treat the count as open.
Four checks before the label
When I think I see an Elliott wave zigzag correction, I go through four checks, always in the same order.
The first check — the larger trend. A zigzag is a correction, so there has to be something to correct. The second — wave A. I go one timeframe lower and count its waves, and if I cannot find five, I stop.
The third — wave B, which must have three waves and must end before the start of wave A. The fourth — the price where the whole idea is wrong. In a zigzag that is the start of wave A.
Do I always find a clear answer? No. On many charts two counts fit the same moves, and then I do not pick one. I wait for the next wave.
The ZigZag indicator in MetaTrader
One more thing causes confusion — the name. MetaTrader has an indicator called ZigZag. It is not the Elliott wave zigzag. The indicator only joins recent highs and lows with straight lines, and its default settings are Depth 12, Deviation 5 and Backstep 3.
The indicator has a property that matters a lot to someone who writes robots. Its last line can move. When a new high or low comes, the indicator draws the latest line again, so a turning point that you saw an hour ago can disappear. The MetaTrader 5 सहायता says the ZigZag is “more suitable for studying past price action than for forecasting”.
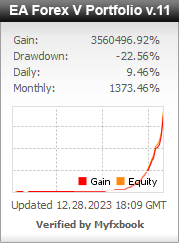
Can a robot count waves? None of mine do. An expert advisor needs a rule that gives the same answer on the same bar tomorrow, in the backtest and on the live account. A wave label that can change later does not pass that test. Our फॉरेक्स वी पोर्टफोलियो trades fixed rules on the H1 chart, and I keep wave counts for my own reading of the market.
So I use the zig zag pattern Elliott wave traders describe as a way to read a correction, and I use the indicator only to mark old highs and lows. If you plan to trade the pattern by hand, you need to decide before the trade where the count becomes wrong.
A zigzag is a count of 5-3-5, a rule for wave B, a set of targets for wave C and a price where the count fails. The more of these you write down before the trade, the steadier you stay when wave C does something you did not expect.
Books behind the rules: R. N. Elliott, The Wave Principle, 1938; A. J. Frost and R. Prechter, Elliott Wave Principle; G. Neely, Mastering Elliott Wave. The indicator description is from the MetaTrader 5 help. Gold levels are rounded daily highs and lows of spot gold, read on 11 November 2026.


 Signal2forex.com - सर्वश्रेष्ठ विदेशी मुद्रा रोबोट और सिग्नल


