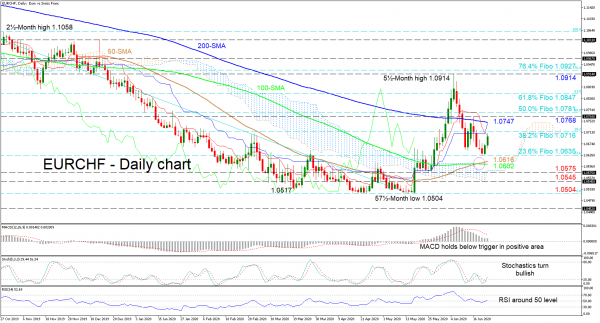
EURCHF found a foothold at the 1.0635 level, that being the 23.6% Fibonacci retracement of the down leg from 1.1058 to 1.0504. The pair was unable to sustain the correction that extended above the 200-day simple moving average (SMA) and as such currently demonstrates weak directional signals, something also reflected within the Ichimoku lines.
Although the technical oscillators were unclear of direction, they now promote the recent improvement off the 1.0635 mark. The MACD, in the positive region, is turning marginally higher below its red signal line, while the strengthening RSI has nudged over the 50 threshold. Moreover, the stochastic %K line has completed a bullish crossover pushing above the 20 level, suggesting upcoming gains. The rising 50-day SMA backs recent positive sentiment, however the 100- and 200-day SMAs continue to endorse a sideways move.
To the upside, immediate resistance could occur at the 38.2% Fibo of 1.0716 ahead of the prevailing 200-day SMA at 1.0747. Moving higher, a resistance region from the 1.0768 high until the 50.0% Fibo of 1.0781 may halt the ascent towards the 61.8% Fibo of 1.0847. If gains extend above 1.0847, the pair may shoot to challenge the 1.0914 peak and 76.4% Fibo of 1.0927 overhead.
Alternatively, if sellers drive the price lower, support may arise from the 23.6% Fibo of 1.0635 located at the nearest trough. A step under could be interrupted by the 50- and 100-day SMAs at 1.0616 and 1.0602 respectively, prior to the 1.0575 barrier. Should the 1.0575 trough fail to curb the decline, the focus could turn to the 1.0545 obstacle and the 57½-month bottom of 1.0504.
Concluding, in the very near-term, the pair is making attempts to strengthen its neutral-to-bullish tone. However, a break of the 1.0914 peak is required to fuel this outlook, while a shift above 1.1058 may turn the short and medium picture into a bullish one.

 Signal2forex.com - Best robots Forex sy famantarana


