
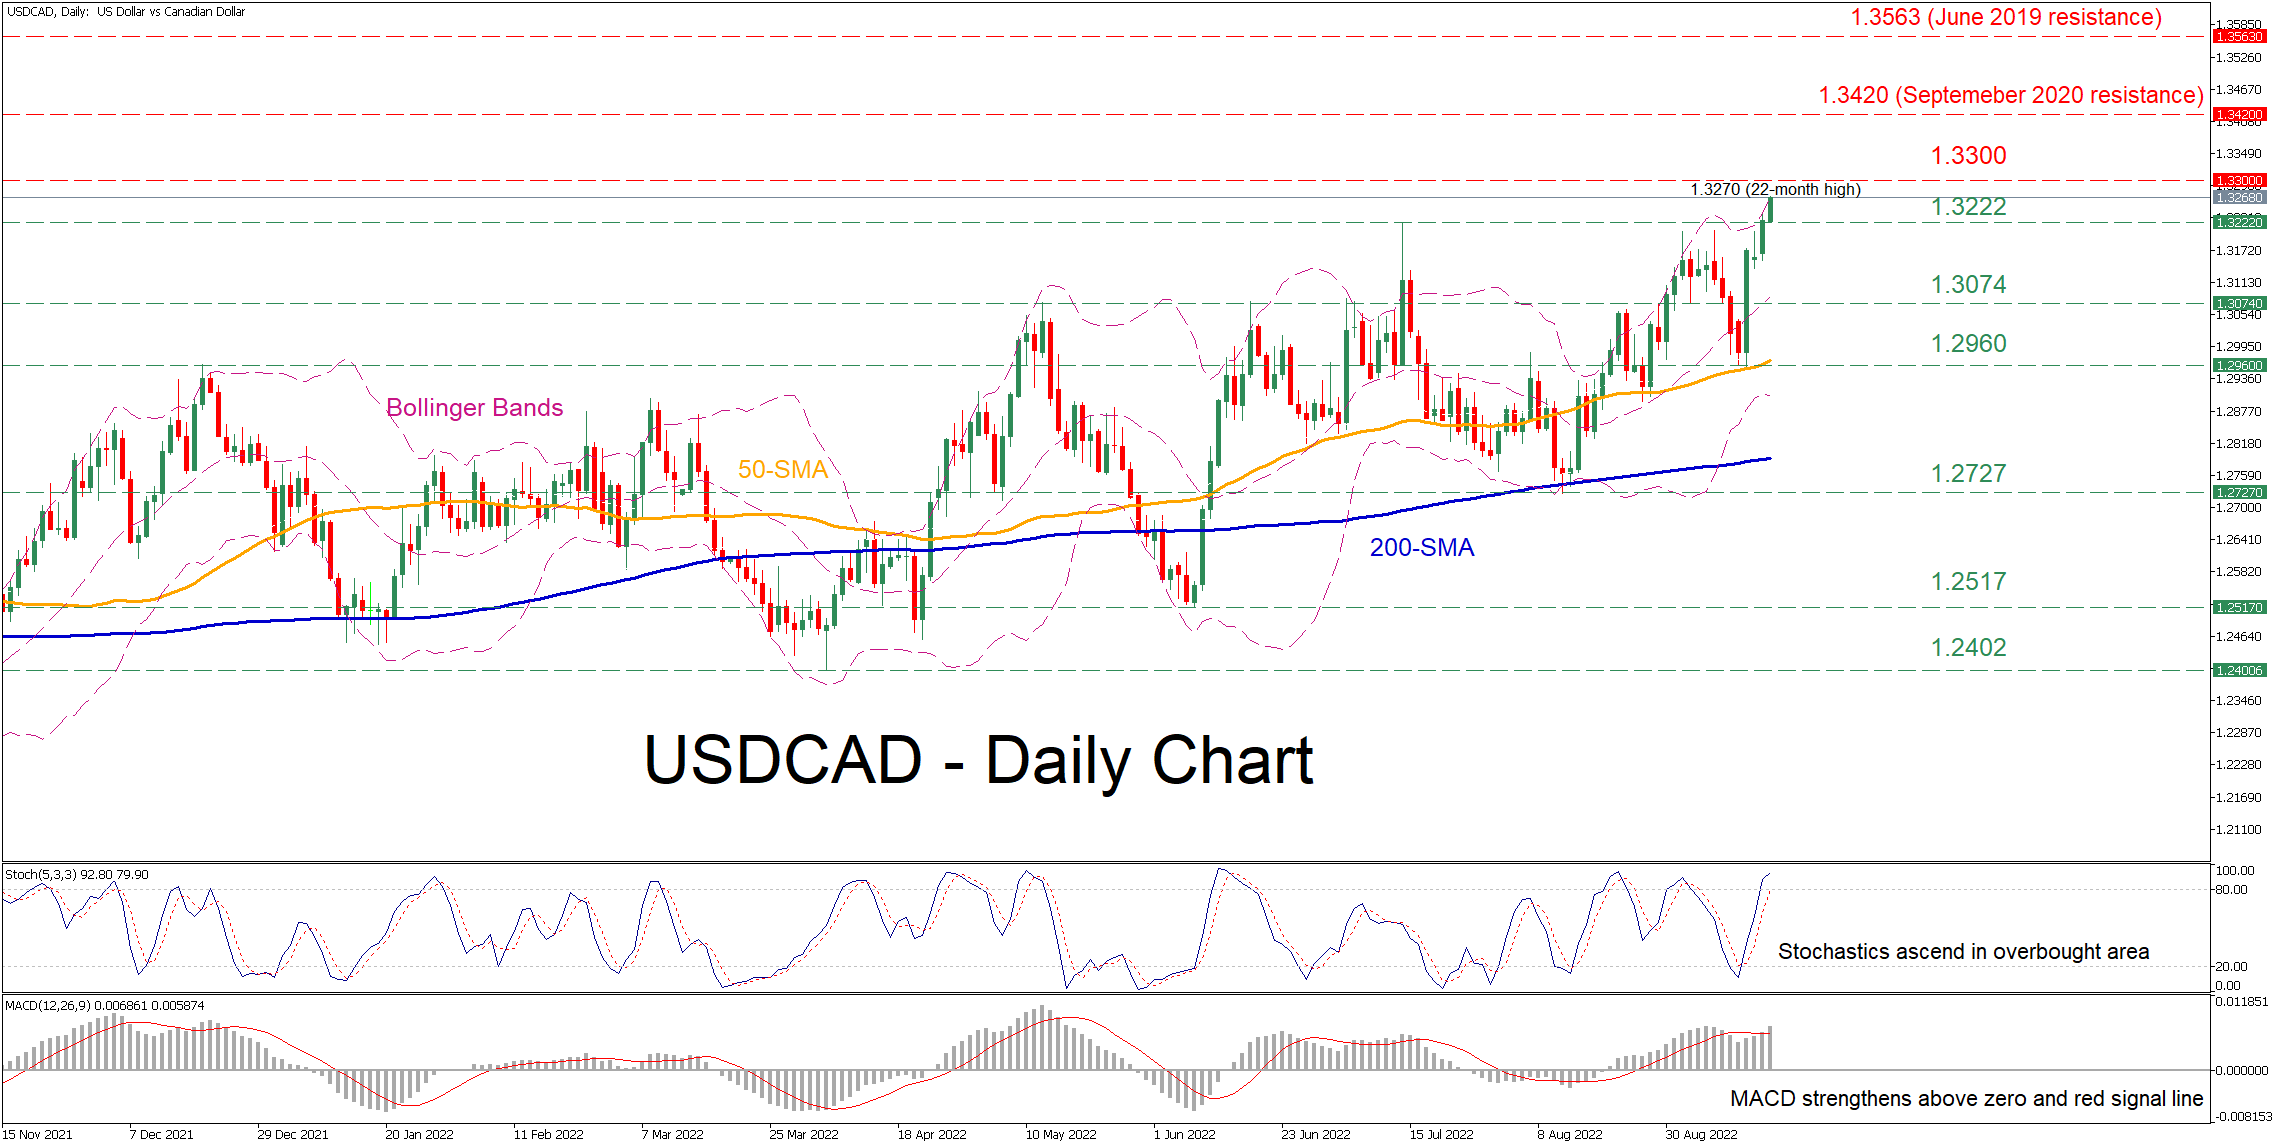
USDCAD has been in an uptrend since early August when the price encountered strong support at the 200-day simple moving average (SMA). Moreover, in the past few sessions, the technical picture has improved even further, with the price recording a fresh 22-month high of 1.3270 and currently trading above its upper Bollinger band.
The momentum indicators also suggest that near-term risks are tilted to the upside. Specifically, the stochastic oscillator is sloping upwards in the overbought area, while the MACD histogram has been strengthening above both zero and its red signal line.
Should buying interest intensify further, the price could ascend to test the 1.3300 psychological mark. Conquering this barricade, the bulls could then target the September 2020 resistance territory of 1.3420. Even higher, any further advances may then halt at the June 2019 resistance of 1.3563.
On the flipside, bearish actions could encounter initial support at the previous peak of 1.3222. Sliding beneath that floor, the pair could challenge the 1.3074 barrier, which has acted both as resistance and support in the past few months. Failing to halt there, the 1.2960 support might prove to be the next obstacle for sellers to overcome.
Overall, USDCAD appears to have the necessary momentum to push even higher and form new multi-year highs. Nevertheless, a downside correction cannot be ruled out as the short-term oscillators are indicating that the pair is approaching overbought levels.
 સિગ્નલએક્સટીએક્સએફએક્સએક્સએક્સક્સ - બેસ્ટ ફોરેક્સ રોબોટ્સ અને સિગ્નલો


