Welcome to Technical Tuesday, a weekly report where we highlight some of the most interesting markets that will hopefully appease technical analysts and traders alike.
In this week’s edition, we are getting technical on silver and the gold-silver ratio; Nasdaq 100, and EUR/USD. So, there’s something for everyone.
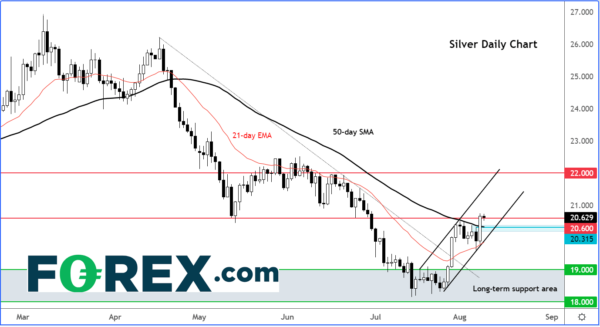
Will silver break further higher?
Silver has now reached $20.60, which we had previously highlighted as our short-term bullish objective and a potential resistance level. The fact that the metal has not reacted much after reaching this level on Monday means there is a possibility that it can now go further higher.
Monday’s large candle that took price above the 50-day average looks quite bullish. For as long as we don’t break Monday’s low, the path of least resistance would remain to the upside for silver, with the top of the bull channel coming in around $21.50ish.
Short-term support is seen around $20.30.
Gold-silver ratio: silver outperformance
A quick look at the weekly chart of gold-silver ratio reveals that the grey metal has started to outshine the yellow metal. The ratio has broken below a trend line after hitting resistance at a historically-important level around 93.35 a few weeks ago. If we see a continuation of the move lower, this will be positive for silver on a relative basis.
Nasdaq reverses
After an impressive recovery, the major global indices have started to struggle in the last few days. Investors face many risks, with growth concerns continuing to rise around the world. Unlike before, central banks are having to tighten monetary policy with aggressive interest rate rises as they try to tame inflation. There is little wonder why the bulls are not so keen to trust this rally.
It might be too early to get bearish, but if we are still in a bear market trend, then we should ignore these signals at our peril. The Nasdaq 100 turned red on Monday after failing to hold the breakout above its bearish trend line. Incidentally, the 38.2% Fibonacci level is also an additional technical factor that is aiding the bearish case.
Key short-term support comes in around 12900, a resistance-turned-support level. For as long as the index holds above here, I don’t think the bulls would be too concerned. But if we start to see the index go back below this level, that’s when things would get interesting.
EUR/USD continues to coil
There’s been a lot of dovish commentary about the euro, yet the single currency is refusing to go down without a fight. In fact, it is putting up a good fight in the face of a bearish macro backdrop. The euro’s resilience is almost commanding. If Friday’s strong US jobs report was unable to cause the EUR/USD to break lower, then you have to start to wonder whether we have seen the low for the year.
As I have been banging on about it for the past couple of weeks, I reckon the downside risks are priced in for the euro, meaning that anything positive from Europe or negative from the US will provide the EUR/USD traders excuse to bid it up from these multi-year lows.
Granted, the long-term trend is still bearish, and it remains to be seen whether the EUR/USD will be able to break above that key 1.0250 resistance level at the umpteenth time of asking. But the length consolidation over the past 4 weeks basically means the bearish momentum has been lost. With rates peaking above the bearish trend line, are we going to see a run to 1.3050 next?
The 1.0350 area was previously support and where we also have the low from January 2017 converge with the 50-day average. If we get there, I would be looking for some sort of a reaction at least given the convergence of these important technical factors there. The trigger to lift the EUR/USD there? A potentially weaker-than-expected US CPI report on Wednesday.
 Signal2forex.com - Rikoodhka ugu fiican iyo calaamadaha


