
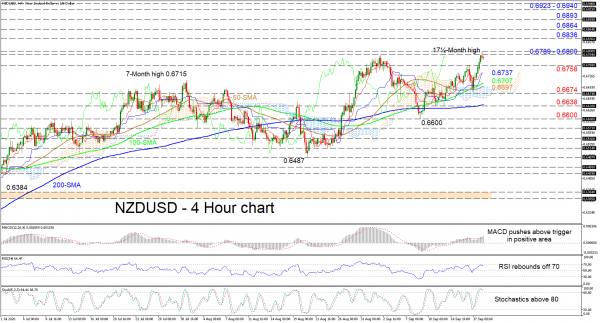
NZDUSD is clashing with the 0.6789 to 0.6800 resistance band following its latest climb from 0.6600, which produced a 17½-month high. The recent pickup in the 50- and 100-period simple moving averages (SMAs) suggest further appreciation in the pair, while the merged Ichimoku lines continue to aid the positive drive in price.
The short-term oscillators reflect a slight weakness in positive sentiment. The RSI and the stochastic oscillator reflect the struggle in the price to overcome the resistance trench. The dipping RSI has deflected off the 70 level, while in overbought territory the fading stochastic lines have yet to confirm bearish tendencies in the price. That said, the MACD, in the positive section, continues to increase above its red trigger line, endorsing advances.
To the upside, if buyers manage to work past the resistance trench of 0.6789 to 0.6800, the pair may propel to test the 0.6836 high from April 2019. Should further gains unfold the pair could challenge the 0.6864 and 0.6893 inside swing lows, before encountering the 0.6923 to 0.6940 area of tough tops, from February and March of 2019.
If sellers take control, initial support may arise from the 0.6758 barrier ahead of the Ichimoku lines currently at 0.6737. Next, the region from the 100-period SMA at 0.6707 until the 50-period SMA of 0.6697, residing at the cloud’s upper surface, may deter the price from seeing the 0.6674 trough. Additional loss of ground could tackle the 200-period SMA, in-line with the 0.6638 lows, before targeting the 0.6600 handle.
Summarizing, the short-term bullish sentiment appears intact above the SMAs and the 0.6674 border. A break above 0.6800 may repower this outlook.
 Signal2forex.com - Najlepsze roboty i sygnały Forex


