Natural Gas is a highly popular commodity, particularly amongst day traders. The spread is reasonable with high liquidity, making it easy for traders to get in and out of trades with little difficulty. Nat gas also appeals to longer term traders because this macro asset has been known to trend for extended periods of time. Furthermore, natural gas is susceptible to pockets of volatility which lead to massive price spikes. The good news is these spikes tend to have a seasonal component to them which traders can use to their advantage.
This article explores the nuances around the fundamental drivers of natural gas and how to trade them.

Natural Gas: Trading Around Seasonal Patterns
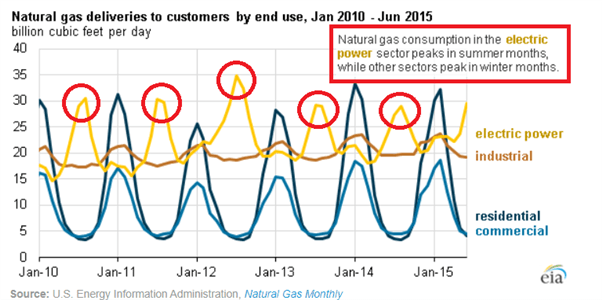
Natural gas is most often used for heating, power generation and industrial processes. The use of natural gas across different sectors (in the US) is rather interesting as the gas tends to exhibit two seasonal peaks in consumption per year.
Seasonal Consumption Patterns
Winter months (consumption): Increased consumption of natural gas as households and businesses use it predominantly for heating.
Summer months (consumption): Increased consumption due to increased electricity demand.
The chart below denotes the summer spikes with red circles while the winter spikes are shown via the blue peaks occurring around January of each year:
Seasonal Price Movements
Winter months (higher average prices): The major peak is usually seen in the winter months as households and businesses use the gas predominantly for heating and reduce a considerable amount of gas storage that has been saved up during the summer.
Summer months (higher average prices): The smaller peak takes place in summer when electricity demand is at its highest, often fueled by increased air conditioning use.
The chart below shows the winter price movements (both higher and lower price movements) in recent years:
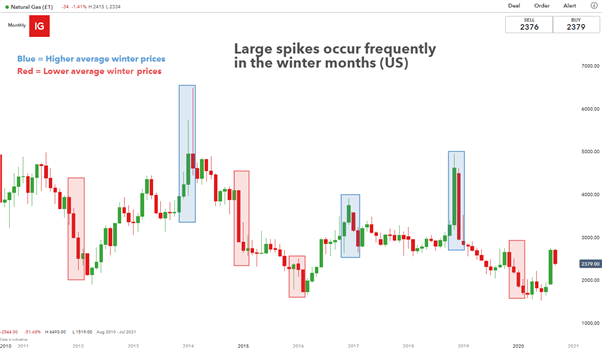
Therefore, traders looking to trade the winter volatility may look for a pull back or period of consolidation in the lead up to the coldest period of the year before trading in the direction of the trend. It is not unusual to witness higher prices in the lead up to the middle of winter, especially if storage figures are lower than average.
This approach is shown below for long trades heading into the coldest period of the year:
Trading natural gas during the winter months


Recommended by Richard Snow
Building Confidence in Trading
Trading Natural Gas Trading: Storage Figures (Demand vs Supply)
The general principle of demand and supply is central to natural gas trading. The relevant storage data required can be found via the U.S. Energy Information Administration website every week. The report shows a breakdown storage changes per region on a weekly, yearly and 5-year average.
Table: US EIA weekly natural gas storage figures
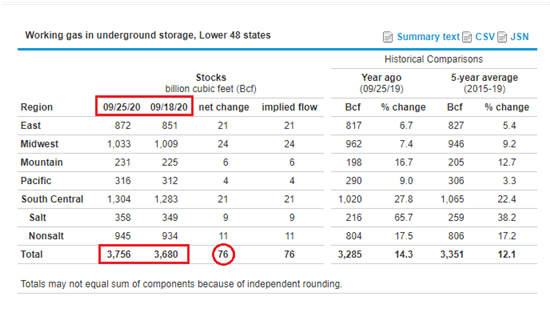
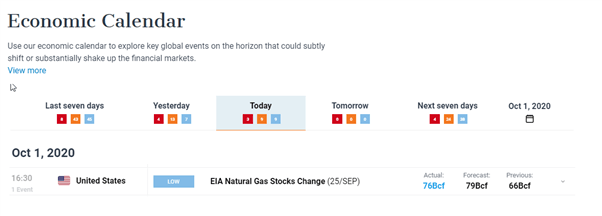
Due to the volatile nature of natural gas around the release of storage figures, it is best to get these figures as soon as possible and in an easy to read manner. At DailyFX we have a comprehensive economic calendar bringing you timely notifications on data that is relevant to you and the markets you trade.


Recommended by Richard Snow
Strategies to help trade around Nat Gas data releases
How Natural Gas Storage Figures Can Influence Price
Sharp declines in storage figures or below average storage for extended periods may provide some info regarding future natural gas prices. The chart below compares natural gas (black dotted line) with the US natural gas stock change (blue line) over the 5 year period September 2015 to September 2020.
Observing this market over such a long time period makes it possible to identify any trends or patterns that would not necessarily show up on a smaller time frame. This analysis technique is called multiple time frame analysis and is a rather popular way to understand any market on a more intimate level.
One observation that appears several times on the chart (in red) occurs once more around the winter months as storage figures drop. The drop in storage happens as a result of increased demand for natural gas for heating among other things. The stored natural gas is drawn upon as demand for the gas outpaces supply in the colder months which results in an increased price for natural gas. The price adjustment is a natural mechanism that is needed to bring demand and supply back into equilibrium. As the colder weather subsides, the demand for the gas decreases and storage figures will begin to increase once more.
Natural Gas Storage vs Natural Gas Price

Storage figures tend to substantiate what was mentioned in the earlier section on seasonal patterns as extreme weather is one of a number of factors that affect natural gas storage.
Traders can once more consider the direction of the trend leading into the winter months and use any number of technical analysis tools to time entries into the market when storage figures drop and prices head higher. Thus far we have only considered long trades, this is because their tends to be greater potential for volatility when prices go up as opposed to when prices go down (or when storage figures increase). However, there do still exist opportunities to short trade natural gas in periods when demand tapers off and inventories begin to pile up.
Trading Natural Gas: The State of the Economy and Supply Disruptions
Using the Economic Cycle as a Trend Filter
The state of the economy also has an effect on natural gas prices due to the gasses strong link to industrial processes. When the economy is growing, there is more infrastructure being built and more machinery that is needed to support it.
Furthermore, the manufacturing industry tends to pick up too as natural gas is used to manufacture a wide range of chemicals such as ammonia, methanol, butane, ethane and propane.
Generally speaking, economic expansions lead to increased demand for natural gas which props up the price of nat gas. This is seen below where the S&P500 is used as a proxy for the health of the economy (in red), with the natural gas price (in blue) moves up in a similar but more extreme fashion.
Trend traders therefore, keep a close watch on where we are in the economic cycle in an attempt to trade in line with the trend. Identify long trades in an expanding economic environment and short trades in a contracting economic environment.
Natural gas prices tend to move inline with the economy

Supply Disruptions
Continuing the analysis over the same time period shown above, there also happened to be 3 major spikes witnessed as a result of external factors or extreme weather conditions outside of the normal warm summer and cold winter weather. Extremely cold temperatures and extreme weather conditions like hurricanes can cause significant supply disruptions, especially if the conditions result in infrastructure damage or delays in transporting natural gas.
This is exactly what happened 2005 and 2008. These extreme cases and one other are explored in greater detail below:
Extreme weather induced spikes in natural gas
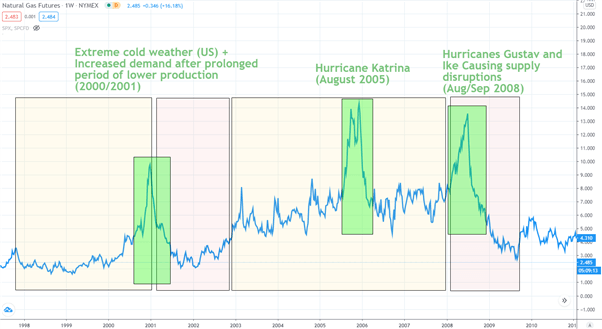
2000/2001: The first big spike in this example was caused by an increase of demand after many years of declined production. The increase in demand was caused by colder than normal weather and because storage figures were particularly low – due to an extended period of low demand – there was a major price shock.
2005: The next spike occurred due to hurricane Katrina in the Gulf of Mexico. The Gulf of Mexico is crucial to the nat gas market as it is home to 51% of total US natural gas processing plant capacity. As a result of the hurricane, supplies from the Gulf of Mexico were significantly impacted, causing a drastic rise in price.
2008: Instead of seasonal weather playing an important role in prices, hurricanes Gustav and Ike cause production shut-ins in the Gulf of Mexico and Louisiana which saw nat gas prices spike in summer and drop in winter – the opposite of what is expected.
Trader take-away: Stay up to date with both the storage figures and the potential for extreme weather in areas that are likely to directly affect natural gas supply chains. Speculators view the above events as an opportunity to benefit from increased nat gas prices and tent to consider timing long entries into the market under these circumstances.


Recommended by Richard Snow
Trading is so much more than just analysis. Find out why
Natural Gas Trading Hours
Being familiar with the natural gas trading hours is key to securing a solid foundation when undertaking natural gas trading. Based on the NYMEX Henry Hub Natural Gas futures (NG) which has become the global standard price reference for Natural Gas, the market times below are important to note:
5:00pm – 4:00pm (Sun–Fri) CT with a 60-minute break each day beginning at 4:00pm CT.
Looking to trade in a simulated environment to better learn strategies, tactics and approach? Click here to request a free demo with IG group.
Resources to Help You Trade Natural Gas
Beginner and advanced traders alike can benefit from the many resources DailyFX provides to inform trading strategies and improve confidence when trading commodities, such as Natural Gas:
- Stay up to date with live Natural Gas prices using our live chart and latest news.
- Discover the main natural gas importing and exporting countries via our interactive global commodities page.
- Bookmark our Economic Calendar to stay informed of up to date storage figures or events which could influence natural gas prices.
- Tune in to our Live Webinars for live access to our DailyFX experts discussing trading strategies, tips, news and forecasts.
- Learn more about technical analysis via our comprehensive education library

 Signal2forex.com - Best Forex robots and signals


