
📑 Table of Contents
1. What Is Trendline Analysis?
Trendline analysis is a fundamental technical analysis method that involves drawing straight lines connecting significant swing highs or swing lows on a price chart. These lines help traders identify the direction of the trend, potential support and resistance levels, and possible breakout or reversal points. Trendlines are one of the oldest and most widely used tools in technical analysis, valued for their simplicity and effectiveness.
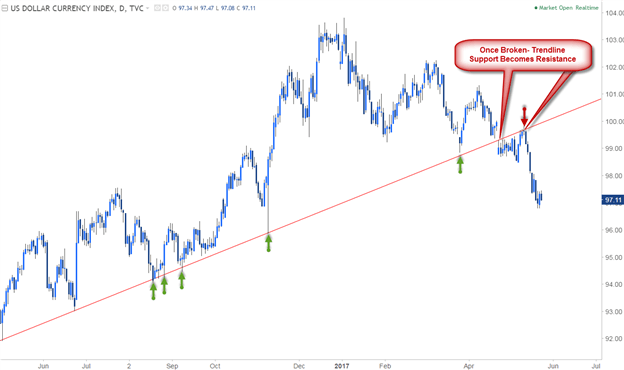
Trendlines work because they represent the path of least resistance in the market. When price respects a trendline, it confirms the prevailing trend. When price breaks through a trendline, it signals that the trend may be changing or accelerating. The psychology behind trendlines is rooted in collective memory — traders remember previous price levels where the market reversed, and these levels become self-fulfilling prophecies.
Trendline analysis is applicable across all timeframes and all markets — forex, stocks, commodities, and cryptocurrencies. Whether you are a day trader, swing trader, or position trader, trendlines can help you make more informed trading decisions.

2. Types of Trendlines
Trendlines come in three main varieties, each corresponding to a different market condition. Recognising the type of trendline in play is essential for selecting the right trading strategy.
| Type | Slope | Market Condition | Trading Implication |
|---|---|---|---|
| Ascending | Upward (positive) | Uptrend / Bullish | Buy on pullbacks to trendline support |
| Descending | Downward (negative) | Downtrend / Bearish | Sell on rallies to trendline resistance |
| Horizontal | Flat (zero) | Sideways / Range | Buy at support, sell at resistance |
📌 Each type of trendline reflects a different market psychology. Ascending lines show buyers in control, descending lines show sellers in control, and horizontal lines show equilibrium.
3. How to Draw Trendlines Correctly
Drawing trendlines correctly is the foundation of effective trendline analysis. A poorly drawn trendline can lead to false signals and costly trading mistakes.
Identifying Swing Highs and Lows
The first step in drawing a trendline is identifying significant swing highs and lows on the chart. A swing high is a price peak that is higher than the bars immediately before and after it. A swing low is a price trough that is lower than the bars immediately before and after it. The more significant the swing (i.e., the larger the price move), the more reliable the trendline will be.
The Three-Touch Confirmation Rule
The three-touch rule is the gold standard for trendline validity. Two points are speculative; three points confirm the validity of the slope. Here is how it works:
- First touch: Establishes the initial slope between two swing points
- Second touch: Confirms the slope is accurate
- Third touch: Validates the trendline as a significant support or resistance level
A trendline with three or more touches is considered highly reliable and respected by market participants.
Common Drawing Mistakes
- Using the wrong swing points: Always use significant swing highs and lows, not minor wicks
- Forcing the line: Don’t force a trendline to fit your bias; let the price guide the line
- Ignoring higher timeframes: A trendline on a 1-minute chart is far less significant than one on a daily chart
- Drawing too many lines: Overcrowding your chart with trendlines creates confusion
4. Trendline Trading Strategies
There are several effective ways to trade with trendlines. The key is to match the strategy to the current market conditions.
Bounce Strategy (Pullback to Trendline)
This is the most common trendline strategy. In a trending market, price often pulls back to the trendline before continuing in the direction of the trend. The strategy is simple:
- Entry: Enter when price touches the trendline with confirmation (candlestick pattern, volume)
- Stop-Loss: Place stop-loss just beyond the trendline
- Take Profit: Target the previous swing high/low or next resistance/support level
Breakout Strategy
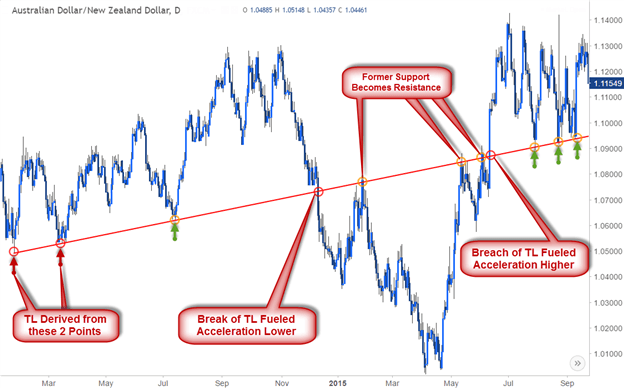
When price breaks through a trendline with conviction, it often signals a trend change or acceleration. The breakout strategy involves:
- Entry: Enter on a confirmed break (daily close beyond the trendline)
- Stop-Loss: Place stop-loss just beyond the broken trendline
- Take Profit: Target the next significant support/resistance level
False Breakout Strategy (Throw-Over)
False breakouts, or throw-overs, occur when price briefly breaks a trendline but fails to accelerate in that direction and quickly reverses. These are common in mature trends and can signal a significant reversal. The strategy is:
- Entry: Enter on the reversal after a false break
- Stop-Loss: Place stop-loss beyond the false break level
- Take Profit: Target the opposite direction of the false break
Multi-Timeframe Trendline Analysis
The most reliable trendline signals come from multi-timeframe analysis. Start by drawing trendlines on higher timeframes (daily, weekly) to identify the major trend. Then, use lower timeframes (4-hour, 1-hour) for precise entries. A trendline that is valid on multiple timeframes is much stronger than one that only appears on a single timeframe.
5. How to Confirm Trendline Breaks
Not every trendline break is a valid signal. Confirmation is essential to avoid false breakouts. The table below outlines the most reliable confirmation methods.
| Method | Description | Reliability |
|---|---|---|
| Daily Close | Price closes beyond the trendline on the daily chart | High |
| Volume Surge | Increased volume on the breakout candle | High |
| Retest | Price returns to the trendline and holds as support/resistance | Very High |
| Candlestick Pattern | Reversal or continuation pattern at the trendline | Medium-High |
| Multi-Timeframe | Confirmation on multiple timeframes | Very High |
📌 The most reliable confirmation combines a daily close beyond the trendline with increased volume and a retest.
6. Trendline vs Other Technical Tools
Trendlines are just one of many technical analysis tools. Understanding how they compare to other tools helps you choose the right approach for your trading style.
| Feature | Trendlines | Moving Averages | Fibonacci Retracement |
|---|---|---|---|
| Objectivity | Subjective | Objective | Objective |
| Dynamic | Yes (static after drawn) | Yes (dynamic) | Yes (static) |
| Support/Resistance | Yes | Yes | Yes |
| Lagging | No | Yes | No |
| Best For | Trend identification | Trend confirmation | Reversal levels |
📌 Trendlines are best for identifying trend direction and key levels. Moving averages are best for confirming trends, and Fibonacci is best for identifying potential reversal levels.
7. Common Mistakes in Trendline Analysis
Even experienced traders make mistakes when using trendlines. Here are the most common pitfalls and how to avoid them.
- Using the Wrong Swing Points: Always use significant swing highs and lows. Using minor wicks or insignificant swings leads to unreliable trendlines.
- Forcing the Trendline: If a trendline doesn’t fit naturally on the chart, the market may not be suitable for trendline analysis. Don’t force it.
- Ignoring Higher Timeframes: A trendline on a 5-minute chart is far less significant than one on a daily chart. Always check higher timeframes for confirmation.
- Trading Every Trendline Touch: Not every touch is a signal. Wait for confirmation signals like candlestick patterns or volume before entering a trade.
- Placing Stops Too Tight: Placing your stop-loss too close to the trendline increases the risk of being stopped out by normal market noise.
- Drawing Too Many Lines: Overcrowding your chart with trendlines creates confusion. Focus on the most significant levels.
8. Frequently Asked Questions
What is trendline analysis in trading?
Trendline analysis is a technical analysis method that involves drawing lines connecting swing highs or swing lows on a price chart to identify trends, support and resistance levels, and potential breakout or reversal points.
How do you draw a trendline correctly?
To draw a trendline, identify at least two significant swing lows (for an uptrend) or swing highs (for a downtrend). Connect them with a straight line. For validity, wait for a third touchpoint to confirm the trendline.
What is the 3-touch rule for trendlines?
The 3-touch rule states that a trendline is only confirmed after the price has touched it at least three times. Two points are speculative; three points confirm the validity of the slope.
What is a trendline breakout?
A trendline breakout occurs when the price moves decisively above a resistance trendline or below a support trendline. A confirmed breakout often signals a trend change or acceleration.
How do you confirm a trendline break?
The most reliable confirmation is a daily close beyond the trendline. Other methods include increased volume on the breakout candle, a retest of the broken trendline, and confirmation on higher timeframes.
What is a false breakout (throw-over)?
A false breakout, or throw-over, occurs when price briefly breaks a trendline but fails to accelerate in that direction and quickly reverses. These often occur in mature trends and can signal a significant reversal.
What is the best timeframe for trendline analysis?
Higher timeframes (daily, weekly) provide more reliable trendlines. Lower timeframes can be used for precise entries but require confirmation from higher timeframes.
Can trendlines be used in all markets?
Yes, trendlines can be applied to any market — forex, stocks, commodities, and cryptocurrencies. They are a universal technical analysis tool.
What is the difference between a trendline and a moving average?
A trendline is a static line drawn manually between price points, while a moving average is a dynamic, objective calculation of average price over a period. Trendlines are more subjective but can identify levels before they occur.
How do you trade a trendline pullback?
In a trending market, wait for price to pull back to the trendline support (uptrend) or resistance (downtrend). Look for confirmation signals (candlestick patterns, volume) before entering in the direction of the trend.
🤖 Automate Your Trendline Strategy: Combine technical analysis with automated trading by exploring our curated collection of forex trading robots and Expert Advisors — fully automated systems designed to execute a variety of strategies, including trend following and breakout trading. Our robots trade 24/7, eliminate emotional decision-making, and have been tested across multiple market conditions, making them ideal for traders who want to automate their trendline-based strategies.
📊 Diversify Your Trading Knowledge: While trendlines help you identify market direction, understanding different investment vehicles is equally important. Read our comprehensive guide on S&P 500 ETFs: Market Cap vs Equal Weight — learn how concentration risk affects ETF performance and why equal-weight ETFs like RSP are gaining popularity in 2026.




 Signal2forex.com - Best Forex robots and signals


