Fibonacci Talking Points:
– Support and resistance is a key aspect of market analysis as it allows traders to set a line-in-the-sand for the setups that they want to take onboard. Traders looking to buy in a market, whether that bullish bias is furnished from fundamental analysis or longer-term technical trends, can look to support so that risk can be controlled.
– Fibonacci retracements are a popular way for traders to look for support or resistance in a market, and this article discusses a simple manner in which they can be used.
If you’re looking for shorter-term indicators, or if you want to see how retail traders are currently trading the US Dollar? Check out our IG Client Sentiment Indicator.
The field of market analytics is full of indicators and strategies with a plethora of ways to find out what to trade and how to do it. As a trader will often find very early, this is more of a study of probability than it is prediction; as analysis is largely relegated to analyzing the past to get the clearest picture of the present. Sure, sometimes those trends that have happened in the past will continue in a manner similar to which they’ve come-in already, allowing the trader to glean a bias that could be usable for their strategies. But, by and large, the primary benefit of analysis, particularly technical analysis, is as a risk management tool.
This is something investigated in the DailyFX Traits of Successful Traders research. In the study, it becomes clear that ‘out-guessing’ the market on a constant and continuous basis isn’t always a recipe for success, as sub-optimal risk management could eliminate the benefit of a slightly favorable winning percentage.
This is where support and resistance can come into play. Support and resistance can help as a risk management mechanism because it provides framework with which the trader can implement their strategy. Let’s say, for instance, a trader is bullish on EUR/USD but is struggling with timing the trade or managing their risk. Rather than just chase the move higher, as driven by FOMO (Fear of Missing Out), the trader can simply wait for some element of support to show up, at which point bullish positions can be investigated. The trader can then implement an if-then statement: If the market remains bullish and if the pair is going to continue to build with bullish structure, then this support should hold and I’ll be able to stay in the trade. Else, the trade can be exited with the goal of loss mitigation, and the trader can simply look to get long at a more favorable price later.
How to Identify Support and Resistance Using Fibonacci
There are a plethora of ways to find support and resistance, and the mechanism for finding levels can range from extremely simple to incredibly ornate. One of the seemingly more advanced methods is actually very simple to use, and this is rooted in the Fibonacci sequence of numbers. That sequence, or at least part of it, is as follows: 1, 1, 2, 3, 5, 8, 13, 21, 34, 55, 89, 144, 233, 377, 610, 987, 1597….
The next number in the sequence can be found by adding the previous two numbers, and this goes on for infinity. What’s interesting about the sequence are the mathematical relationships within. Each number is 1.618 times the prior number’s value. This is called ‘Phi,’ or commonly known as The Golden Ratio, and this can be found throughout the world in front of us: In architecture or art, or even in nature with the ratio of spirals in a pine cone or the breeding cycle of rabbits.
To traders, the importance of Fibonacci deals with the mathematical relationship within the sequence. Each number in the sequence (after the initial portion) is 61.8% of the next number’s value. So, 34 divided by 55 is .618, and 55/89 is the same .618. This relationship will hold true into infinity, and this is a key variable in Fibonacci studies on traders’ charts.
This will often be plotted as a 61.8% retracement of a major move.
Taking this a step further, each number in the sequence divided by two numbers later is 38.2%. So, 34 divided by 89 is .382, and 89 divided by 233 is the same.
This will also be plotted within a Fibonacci retracement study, and this will show at 38.2% of the analyzed move.
The 23.6% retracement comes from taking any number in the sequence, and dividing it by the number three places to its right. So 34 divided by 144 is .236 and 55 divided by 233 is the same. Again, this relationship will hold into infinity, and this gives us another retracement level that we can add to our charts.
Collectively, this produces potential support/resistance levels based on the prior major move, and those intervals show at 23.6%, 38.2% and 61.8%, as shown below.
GBP/USD Weekly Chart: Fibonacci Applied to ‘Brexit Move’ (in Red)
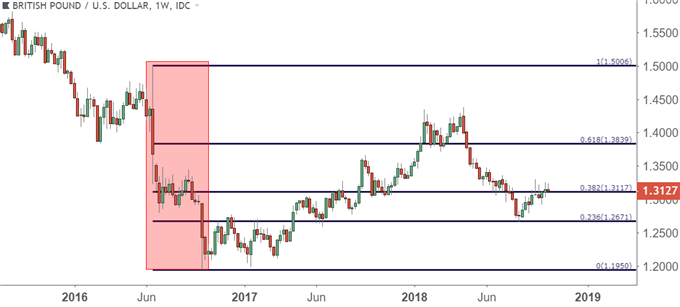
Chart prepared by James Stanley
Taking it a Step Further
If you’ve seen Fibonacci applied to a trading chart, you’ve probably seen a couple of additional levels, and these are a bit more subjective as they’re not ‘true’ Fibonacci levels. The mid-way marker, or the 50% ‘retracement’ is often a fixture on the chart. It has no Fibonacci value whatsoever, and merely marks the midpoint of the analyzed move.
Another common level that does carry some value is 78.6. Adding this level to the Fibonacci retracement provides a sense of balance as there are two levels above and two levels below the 50% marker. The value of .786 does have some Fibonacci bearing, as this is the square root of .618; and the 78.6% retracement will often be looked at for ‘deep’ retracements or potential reversal plays.
How to Trade Fibonacci Support and Resistance
Fibonacci retracement levels can be utilized as any other potential support or resistance mechanism: As mere potential until it begins to come into play, at which point it offers the opportunity for a trader to implement an if-then statement. If support holds, then this trade could work out nicely. If support doesn’t hold, get out quickly and look for greener pastures elsewhere.
Making matters more interesting is the subjective nature with which Fibonacci retracements can be applied. Traders can choose long-term major moves in order to look for levels of interest for bigger-picture strategy or even intra-day levels for trading swings. Or, Fibonacci can be applied to shorter-term charts in the effort of finding levels to base shorter-term themes and setups from.
The starting point for applying a Fibonacci retracement is to find a major move of note, and then to apply the indicator from the starting point of the move to the finish. Below is a Fibonacci retracement applied to GBP/USD, and focusing on the major move that was produced around Brexit. This takes the June 2016 high of 1.5006 down to the October low from the same year at 1.1950. Notice the horizontal lines drawn at specific intervals of 23.6, 38.2, 50, 61.8 and 78.6: These are each Fibonacci retracement levels with which traders can look to for support and/or resistance as prices continue to gyrate.
GBP/USD Weekly Price Chart
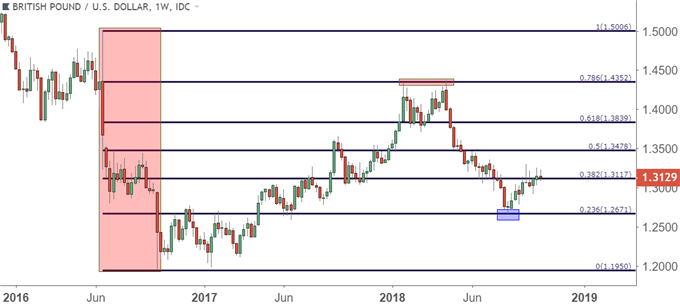
Chart prepared by James Stanley
As can be seen from the above chart, the retracement levels produced by this major move continue to carry weight more than two years after the move actually came-in. Today’s short-term support is coming in at the same 38.2% retracement level of 1.3117 that’s been in play for the past few weeks; and this comes after a rather aggressive bullish reversal built-in off of support at the 23.6% marker in mid-August of this year.
Drawing back to the month of April, there was a far different tonality in the Pound, and this is when the 78.6% retracement of that same Fibonacci study helped to mark the yearly high in the pair around 1.4350. This actually occurred two separate times earlier in the year, as this resistance helped to mark a double-top formation before the big reversal began to show.
But even before that top was in-place, when GBP/USD spent much of 2017 recovering from the Brexit-driven sell-off of 2016, that up-trend gyrated within that Fibonacci structure: Resistance at the 23.6 followed by support at prior resistance. A similar instance took place at the 38.2% retracement, as well as the 50% mid-point of the major move.
GBP/USD Daily Price Chart: Focus on 2017 Bullish Move in GBP/USD
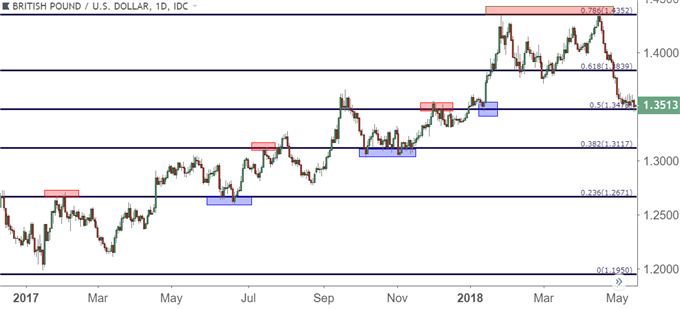
Chart prepared by James Stanley
Application in Equities
Fibonacci retracements can also be utilized across equity indices on both short and long-term basis. The earlier-year correction that took place in US equities helped to mark a 38.2% retracement in the Dow Jones Industrial Average, taking the low from the night of the 2016 Presidential election up to the January, 2018 high.
Dow Jones Daily Price Chart: Earlier-Year Correction Marked by 38.2% Retracement of Post-Election Run
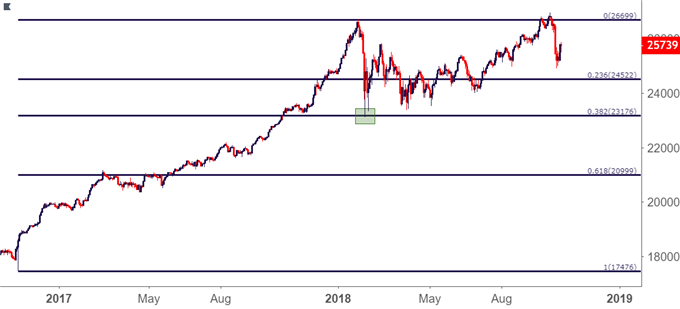
Chart prepared by James Stanley
And on a shorter-term basis, the recent sell-off in US stocks marked a 61.8% retracement of the prior bullish trend from Q3, and there have been follow-through instances of short-term intra-day support and resistance at the 50% and 38.2% markers.
Dow Jones Four-Hour Price Chart: Retracement from Q3 Trend Helps to Set Context
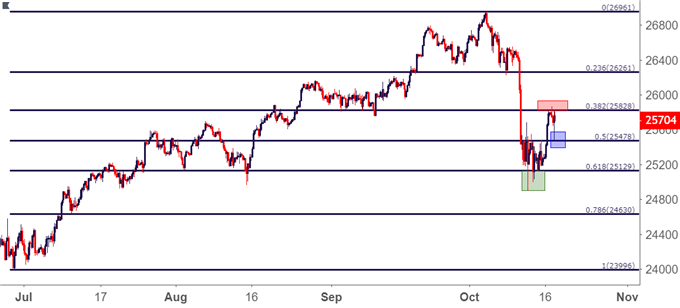
Chart prepared by James Stanley
To read more:
Are you looking for longer-term analysis on the U.S. Dollar? Our DailyFX Forecasts for Q1 have a section for each major currency, and we also offer a plethora of resources on USD-pairs such as EUR/USD, GBP/USD, USD/JPY, AUD/USD. Traders can also stay up with near-term positioning via our IG Client Sentiment Indicator.
Forex Trading Resources
DailyFX offers a plethora of tools, indicators and resources to help traders. For those looking for trading ideas, our IG Client Sentiment shows the positioning of retail traders with actual live trades and positions. Our trading guides bring our DailyFX Quarterly Forecasts and our Top Trading Opportunities; and our real-time news feed has intra-day interactions from the DailyFX team. And if you’re looking for real-time analysis, our DailyFX Webinars offer numerous sessions each week in which you can see how and why we’re looking at what we’re looking at.
If you’re looking for educational information, our New to FX guide is there to help new(er) traders while our Traits of Successful Traders research is built to help sharpen the skill set by focusing on risk and trade management.
— Written by James Stanley, Strategist for DailyFX.com
Contact and follow James on Twitter: @JStanleyFX

 Signal2forex.com - Best Forex robots and signals


