

📑 Table of Contents
- 1. What Are the Types of Forex Analysis?
- 2. Fundamental Analysis
- 3. Technical Analysis
- 4. Sentiment Analysis (Market Sentiment)
- 5. Comparison of Forex Analysis Methods
- 6. How to Combine the 3 Types of Forex Analysis
- 7. Which Type of Forex Analysis Is Best for Beginners?
- 8. Frequently Asked Questions
1. What Are the Types of Forex Analysis?
When it comes to trading currencies, forex analysis is the foundation of every successful strategy. Traders use three main types of analysis to understand market movements and make informed decisions. These are fundamental analysis, technical analysis, and sentiment analysis.
Each type of analysis approaches the market from a different angle. Fundamental analysis looks at the economic factors that drive currency values. Technical analysis studies price patterns and historical data. Sentiment analysis measures the psychological state of the market. The most successful traders understand all three and use them together to build a comprehensive market view.
In this guide, we will explore each type of analysis in detail, explain how they work, and show you how to combine them for better trading results.
2. Fundamental Analysis
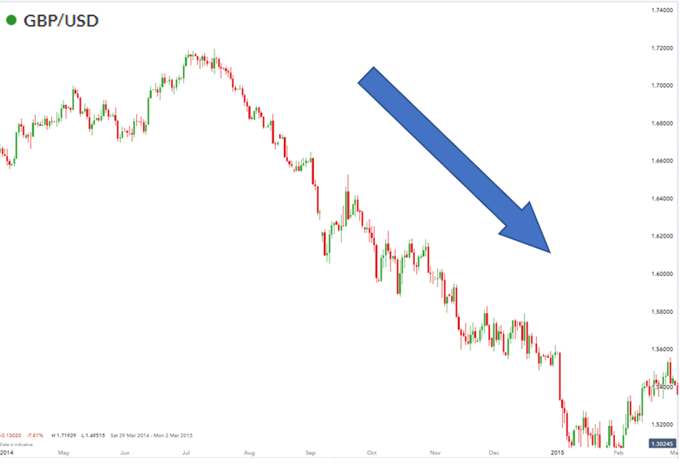
Fundamental analysis is the study of economic, social, and political factors that affect currency values. It answers the question: “Why should a currency move in a certain direction?” This type of analysis focuses on the intrinsic value of a currency based on the strength of its underlying economy.
What Is Fundamental Analysis?
Fundamental analysis examines macroeconomic indicators, central bank policies, and geopolitical events to determine a currency’s long-term direction. It is based on the idea that a currency’s value is ultimately determined by the economic health of its country.
Key Fundamental Indicators
The most important economic indicators for fundamental analysis include:
- Interest Rates: Higher interest rates attract foreign capital, strengthening a currency. Lower rates tend to weaken it.
- Gross Domestic Product (GDP): Strong GDP growth indicates a healthy economy, which typically supports a stronger currency.
- Inflation (CPI): Rising inflation may lead to higher interest rates, which can strengthen a currency. However, very high inflation can be negative.
- Employment Data: Strong employment figures suggest economic strength and can lead to currency appreciation.
- Central Bank Policy: Statements from central banks about future interest rate decisions are among the most powerful drivers of currency movements.
How to Use Fundamental Analysis in Forex
To use fundamental analysis effectively, traders monitor an economic calendar for upcoming data releases and central bank meetings. They compare actual results against market expectations. If a release is better than expected, it typically strengthens the currency; if worse, it weakens it.
Fundamental analysis is particularly useful for long-term position trading and for understanding the broader trend direction. It helps traders identify which currencies are likely to strengthen or weaken over time.
Pros and Cons of Fundamental Analysis
- ✅ Pros: Identifies long-term trends; explains why price moves; useful for position trading; based on real economic data.
- ❌ Cons: Can be slow to react to market sentiment; requires deep economic knowledge; news releases can cause high volatility.
3. Technical Analysis
Technical analysis is the study of historical price data and trading volume to forecast future price movements. It answers the question: “When should I enter or exit a trade?” This type of analysis assumes that all known information is already reflected in the price.
What Is Technical Analysis?
Technical analysis focuses on price charts, patterns, and indicators. It is based on three core principles: price discounts everything, price moves in trends, and history tends to repeat itself. Technical traders believe that by studying past price behaviour, they can identify patterns that are likely to repeat.
Key Technical Tools and Indicators
The most common technical analysis tools include:
- Moving Averages: Smooth out price data to identify trend direction (e.g., 50-day, 200-day MA).
- Relative Strength Index (RSI): Measures momentum and identifies overbought/oversold conditions.
- MACD: Shows the relationship between two moving averages to identify trend strength.
- Support and Resistance: Key price levels where price has historically reversed.
- Candlestick Patterns: Visual patterns like hammers, engulfing patterns, and dojis that signal potential reversals.
- Fibonacci Retracement: Identifies potential reversal levels based on mathematical ratios.
How to Use Technical Analysis in Forex
Technical analysis is used to time entries and exits. Traders look for buy signals when indicators suggest a currency is oversold or when price breaks above a resistance level. They look for sell signals when indicators suggest overbought conditions or when price breaks below support.
Technical analysis works on all timeframes, from 1-minute charts for scalping to monthly charts for position trading. It is particularly valuable for short-term and medium-term trading strategies.
Pros and Cons of Technical Analysis
- ✅ Pros: Provides precise entry and exit signals; works on all timeframes; objective rules-based approach; can be used in any market.
- ❌ Cons: Can generate false signals; lagging indicators may delay entries; requires practice to master; can be subjective in pattern interpretation.
4. Sentiment Analysis (Market Sentiment)
Sentiment analysis measures the psychological state of the market. It answers the question: “How are other traders positioned?” This type of analysis is based on the idea that markets are driven by human emotions — fear, greed, and hope — and that extreme sentiment can signal potential reversals.
What Is Sentiment Analysis?
Sentiment analysis gauges whether traders are bullish (expecting prices to rise) or bearish (expecting prices to fall). It looks at positioning data, surveys, and other indicators to measure market psychology. The principle is that when sentiment reaches an extreme, a reversal is often imminent.
Key Sentiment Indicators
The most useful sentiment indicators include:
- COT Report (Commitment of Traders): A weekly report showing the positioning of commercial hedgers, large speculators, and small traders in futures markets. It provides insight into institutional positioning.
- Put/Call Ratio: Measures the ratio of put options to call options. A high ratio suggests bearish sentiment, while a low ratio suggests bullish sentiment.
- VIX (Volatility Index): Often called the “fear gauge,” the VIX measures market volatility and fear. High VIX readings indicate fear, while low readings indicate complacency.
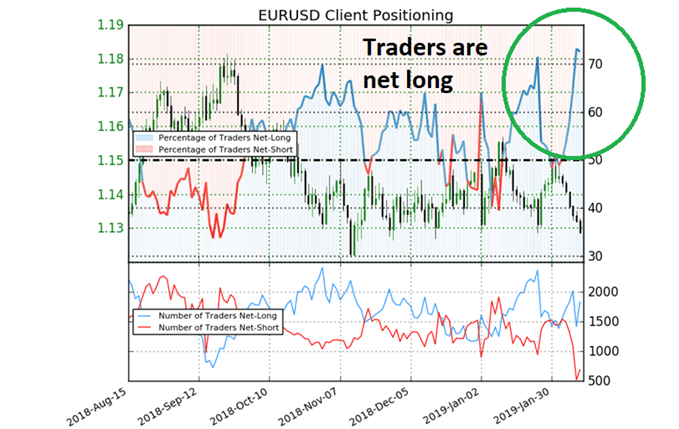
- Retail Trader Positioning: Many brokers publish data showing the percentage of their clients who are long or short on a currency pair.
- News and Social Media Sentiment: Analyzing the tone of financial news and social media can provide clues about market sentiment.
How to Use Sentiment Analysis in Forex
Sentiment analysis is often used as a contrarian indicator. When retail traders are overwhelmingly long on a currency, it may be a sign that the trend is overextended and a reversal is near. Similarly, when institutional traders (commercial hedgers) are heavily positioned in one direction, it can indicate a strong underlying trend.
The key is to combine sentiment analysis with other methods. For example, if sentiment is extremely bearish but technical indicators show a bullish divergence, it may be a powerful buy signal.
Pros and Cons of Sentiment Analysis
- ✅ Pros: Provides early warning of potential reversals; gauges market strength; offers contrarian opportunities; complements other analysis methods.
- ❌ Cons: Can be subjective; data can be delayed; requires experience to interpret; extreme sentiment can persist longer than expected.
5. Comparison of Forex Analysis Methods
The table below compares the three types of forex analysis side-by-side to help you understand their differences and choose the right approach for your trading style.
| Feature | Fundamental Analysis | Technical Analysis | Sentiment Analysis |
|---|---|---|---|
| Focus | Economic factors, interest rates, GDP, inflation | Historical price data, charts, patterns | Market psychology, trader positioning |
| Time Horizon | Long-term (weeks to years) | Short to medium-term (minutes to months) | Short to medium-term |
| Key Tools | Economic calendar, news, central bank statements | Indicators, trendlines, candlestick patterns | COT reports, put/call ratios, VIX |
| Best For | Understanding why price moves | Identifying when to enter/exit | Gauging market strength |
| Main Advantage | Identifies long-term trends | Precise entry/exit signals | Early warning of reversals |
| Main Disadvantage | Can be slow to react | Can generate false signals | Can be subjective |
📌 Each type of analysis serves a different purpose. The most successful traders combine all three for a complete market picture.
6. How to Combine the 3 Types of Forex Analysis
Using all three types of analysis together provides a complete market picture. Each method answers a different question:
- Fundamental analysis tells you why the price should move in a certain direction.
- Technical analysis tells you when to enter and exit a trade.
- Sentiment analysis tells you how strong the move is likely to be.
Here is a step-by-step approach to combining the three methods:
- Start with Fundamental Analysis: Identify the long-term trend by analysing economic indicators, central bank policy, and macroeconomic factors. This gives you the “big picture” direction.
- Use Technical Analysis for Timing: Once you know the trend direction, use technical analysis to find optimal entry and exit points. Look for support/resistance levels, momentum indicators, and price patterns that align with the fundamental trend.
- Check Sentiment for Confirmation: Before entering a trade, check sentiment indicators to confirm that the market is not overextended. If sentiment is extreme in the opposite direction, it may be a contrarian signal.
Example: Suppose fundamental analysis suggests the US dollar will strengthen due to rising interest rates. Technical analysis shows the EUR/USD is approaching a strong resistance level. Sentiment analysis reveals that retail traders are overwhelmingly long on EUR/USD. This combination would provide a strong sell signal.
7. Which Type of Forex Analysis Is Best for Beginners?
For beginners, technical analysis is often the most accessible starting point. It provides clear, visual signals and does not require deep knowledge of economics. You can learn to read charts, identify patterns, and use basic indicators relatively quickly.
However, the best approach is to learn all three methods gradually. Start with technical analysis, then add fundamental analysis to understand the broader context, and finally incorporate sentiment analysis to refine your entries and exits.
Many beginners make the mistake of relying on just one method. This can lead to missed opportunities or false signals. By combining all three, you can build a more robust and reliable trading strategy.
8. Frequently Asked Questions
What are the 3 types of forex analysis?
The three main types of forex analysis are fundamental analysis (economic factors), technical analysis (price patterns and indicators), and sentiment analysis (market psychology and trader positioning).
What is fundamental analysis in forex?
Fundamental analysis examines economic indicators, interest rates, inflation, GDP, and political events to determine a currency’s long-term value and direction.
What is technical analysis in forex?
Technical analysis studies historical price data, chart patterns, trendlines, and indicators to identify potential entry and exit points.
What is sentiment analysis in forex?
Sentiment analysis gauges market psychology by measuring whether traders are bullish or bearish on a currency, often using COT reports and other positioning data.
Which type of forex analysis is best for beginners?
Technical analysis is often recommended for beginners because it provides clear entry and exit signals. However, combining all three methods is considered the best practice.
How do you combine fundamental and technical analysis?
Use fundamental analysis to identify the long-term trend and technical analysis to time your entries and exits within that trend.
What is the role of sentiment analysis in forex trading?
Sentiment analysis helps you understand market psychology and can provide early warning signals of potential reversals when sentiment reaches extreme levels.
What are the key indicators for fundamental analysis?
Key indicators include interest rates, GDP growth, inflation (CPI), employment data, and central bank policy statements.
What are the key indicators for technical analysis?
Key indicators include moving averages, RSI, MACD, support and resistance levels, and candlestick patterns.
Why should I use all three types of forex analysis?
Using all three methods provides a complete market picture: fundamentals tell you why price should move, technicals tell you when to enter/exit, and sentiment tells you how strong the move will be.
📰 Stay Ahead of the Market: For real-time updates on economic indicators, central bank decisions, and market-moving news, visit our dedicated Forex News section. Stay informed about the fundamental factors driving currency movements and never miss a key economic release that could impact your trades.
📊 Enhance Your Technical Analysis: Browse our collection of Forex Indicators for Download — including custom indicators, oscillators, and trading systems designed to improve your technical analysis and help you identify high-probability trading opportunities.



 Signal2forex.com - Best Forex robots and signals


