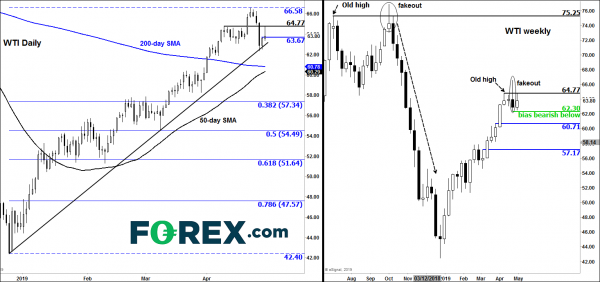
After the sharp mid-week reversal, crude oil prices started this week on the front foot. Investors were making a more sober assessment of what Donald Trump said and how the OPEC could possibly accept bringing oil prices lower given that it is mainly the US they are at war with. Nonetheless, the technical damage may have already been incurred after last week’s slide and speculators are not comfortable holding onto their long positions for too long because of that. Indeed, at the time of writing, both crude contracts were coming off their best levels sharply, tracking equity markets lower. Initially, oil investors had shrugged off renewed demand concerns over China after the latest manufacturing PMI data barely showed expansion in economic activity there. However, the selling pressure resumed after midday in London and increased further when US investors came into play in the afternoon. As we went to press, WTI was barely in the positive territory.
From a technical point of view, crude oil’s slide last week looks very similar to when prices topped out back in October. Then, WTI’s attempt to break above the old high at $75.25 was rejected, resulting in the creation of an inverted hammer candle on the weekly chart. The following week, WTI initially rose to re-test that $75.25 level before taking a nose dive. Fast forward to last week, WTI broke its most recent old high at $64.77, before diving below that level to end the week with a similar inverted hammer candle as it did in October. Today, it has re-tested that $64.77 level again and so far the bears have defended it. So, if history were to repeat itself, WTI could be on the verge of a massive slide. But before we get too bearish, the US oil contract needs to break last week’s low at $62.30 for the selling to accelerate. By doing so, it will also take out its bullish trend line that is visible on the daily chart, thus further confirming the bearish reversal. However, a daily close back above the $64.77 level would probably invalidate this bearish outlook.


 Signal2forex.com - Best Forex robots and signals


