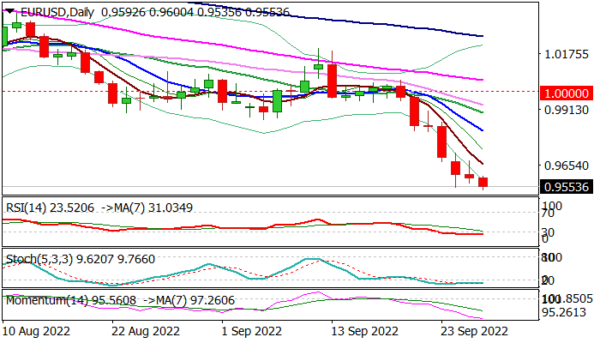
EUR/USD Outlook: Bears Likely to Travel Further as Conditions Continue to Worsen
The Euro hit new marginally lower 20-year low in early Wednesday, as risk assets fell in Asia, lifting the dollar to new high. Technical studies show indicators on daily chart in full bearish setup, with oversold conditions likely to slow...
Gold Price Analysis Today: XAUUSD Support & Resistance
✅ Updated: July 3, 2026 Gold Price Analysis Today: XAUUSD Surges Above $4,170 📑 Table of Contents 1. Key Highlights 2. Gold Price Technical Analysis — XAUUSD 3. XAUUSD Support and Resistance Levels 4. Gold Trading Strategy — How to...
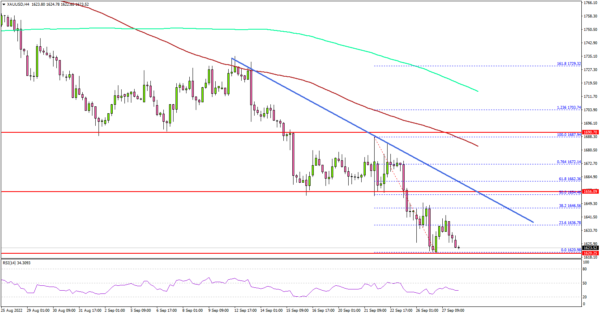
Gold Price Turns Red Below $1,650, Upsides Capped
Key Highlights Gold price extended losses below the $1,650 support. A major bearish trend line is forming with resistance near $1,650 on the 4-hours chart. EUR/USD and GBP/USD might start a fresh downward move. USD/JPY could clear the last high...
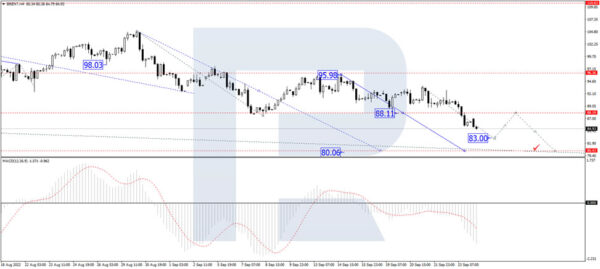
Brent Dropped to Its February Lows
The commodity market is now experiencing a huge stress due to concerns of the reduction in demand for energies. Early in the week, Brent dropped to $85.35 and no other negative factors have appeared since then. However, those that are...
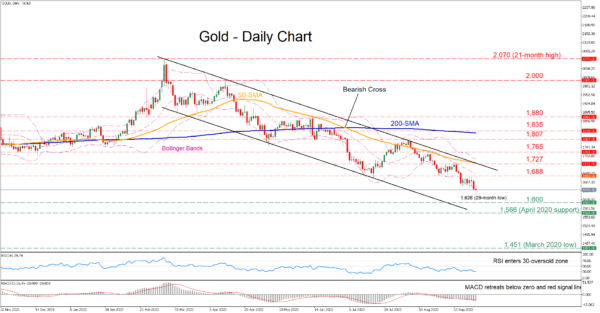
Gold Extends its Decline to Fresh 29-Month Lows
Gold has been losing ground since early March, generating a profound structure of lower highs and lower lows within a descending channel. Furthermore, in the last few daily sessions, the technical picture has deteriorated, with the pair forming consecutive fresh...

GBP/USD Outlook 2026: Where Will the Pound-Dollar Go?
✅ Updated: July 2026 The GBP/USD — often referred to as “Cable” — is one of the most actively traded currency pairs in the world. This comprehensive guide provides in-depth technical and fundamental analysis, key support and resistance levels, and...

Gold Falls Below $1650 as US Dollar Soars
On the back of fresh data via the PMI flashes out of the EU and UK, which showed that both economies are in contractionary territory, the EUR/USD and GBP/USD are trading lower on the day. As a result, the strength...

GBP/USD: Sterling Falls to New Multi-year Low after Disappointing Data
Cable accelerates below 1.12 mark on Friday and hit new lowest since 1985, in extension of steep bear-leg from 1.1738 (Sep 13 lower top), which is a part of larger downtrend from 1.4249 (June 2021 peak. The action in Asian...

USD/JPY Dips As Bulls Take Breather, Gold Consolidates
Key Highlights USD/JPY started a downside correction from the 145.90 high. It broke a major bullish trend line at 143.75 on the 4-hours chart. Gold price is still consolidating below the $1,700 resistance zone. The US Manufacturing PMI could decline...

CHFJPY Sinks to 2-Week Low; Bullish Structure Intact
CHFJPY lost almost 2.0% within two hours during Thursday’s European trading hours, plunging to a two-week low of 143.92 before edging slightly higher. The technical oscillators followed the price sharply lower, with the RSI sliding below its 50 neutral threshold...
Join us on Facebook
 Signal2forex.com - Best Forex robots and signals
Do you want to have such profits and charts? Click for more info…

Recommended fast VPS provider

I have been with this company for the second month with a v.11+ VPS robot with a smaller deposit and I am satisfied. For a monthly fee of $30 from the second month, I don’t have to worry about anything and just watch the earnings. The robot earns, the Skype support is excellent and you can see that it understands trading. In the future, I will definitely increase the deposit for full use of the robot to 14 pairs. I recommend Signal2forex!!!!!

From the beginning I didn’t trust the EA robot FOREX V PORTFOLIO v.11 pro 14 because I had other trades than shown in the video on the website. After a month on two demo accounts with a deposit of 2000 USD, I must say that the EA works very well!!! Monthly appreciation of both accounts approx. 30% with max DD 19%. I have to praise the developers and keep my fingers crossed for the future.

Guys are geniuses!!! I am grateful for your work!!! Everything works, they helped me install everything and there is always feedback !!! Thanks!!!

Trading education

Trendline Analysis: Complete Trading Guide 2026✅ Updated: July 2026 📑 Table of Contents 1. What Is Trendline Analysis? 2. Types ... 
DailyFX Trading Course Walkthrough: Part Two (2026)✅ Updated: July 2026 Welcome to Part Two of the DailyFX forex trading course walkthrough ... 
The Truth About Forex Trading: Myths vs Facts Exposed (2026)✅ Updated: July 2026 📑 Table of Contents 1. What Is the Truth About Forex ... 
Daily Forex Trading Course Walkthrough: Part FiveForex Trading Course Walkthrough Talking Points: This is the fifth of a ten-part series in ... |