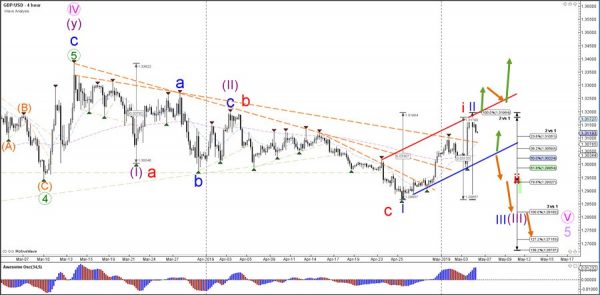
The GBP/USD could still be in the wave 1-2 (blue) pattern but this outlook has become less probable after the large spike up. The alternative is a bullish wave 1-2 (red) pattern after price completed a bearish ABC (red) pattern. The correct wave pattern will depend on the breakout of the trend channel. A bullish break above the resistance (red) indicates an uptrend whereas a break below the support (blue) indicates a downtrend.
The GBP/USD could have completed a potential bullish ABC (green) pattern if price manages to make a wave 1-2 (green) pattern and bearish reversal in this zone. However, a break above the 1.3186 indicates that price probably made 5 waves up (rather than an ABC) and also means that price is undergoing a trend change and invalidating both waves 1-2 (blue/green). For the moment, the GBP/USD remains in a difficult spot and needs to move substantially lower or higher to confirm/invalidate one of the wave patterns.


 Signal2forex.com - Best Forex robots and signals


