
By Uladzimir Leuchankou, founder of Signal2Forex · 7 November 2026
What is a spinning top candlestick? A candle with a small body and a wick on each side — a day when buyers and sellers both pushed and neither side won. I suppose that is an answer too. But for me a spinning top is first a question about numbers. How small is small? And what was the market waiting for on that day?
I took 21 daily candles of AUD/USD, from 25 September to 23 October 2026, and counted. Four of them pass my test for a spinning top candlestick pattern. Two were followed by a fall, one by a rise and one by another spinning top. The table shows all four.
| Date | Candle | Next day |
|---|---|---|
| 25 September | white, body 12 of 41 pips | another spinning top |
| 28 September | black, body 8 of 35 pips | down 31 pips |
| 8 October | black, body 7 of 41 pips | up 27 pips |
| 14 October | black, body 9 of 65 pips | down 50 pips |
Daily AUD/USD candles, 25 September – 23 October 2026. One pip here is 0.0001.
Small body, two wicks
The candlestick spinning top takes its name from a child’s toy — a thick middle and a thin pin on each end. Some traders write the name shorter, spin top candle. The body is the distance between the open and the close. The wicks show how far price went above and below the body before it came back.
Take the candle of 14 October. AUD/USD opened at 0.6980, climbed to 0.7015, dropped to 0.6950 and closed at 0.6971. This is 65 pips of travel and only 9 pips between open and close. On one standard lot those 65 pips are about $650, and on a 0.01 lot they are $6.50. If pips are new to you, I explain them in a separate article.
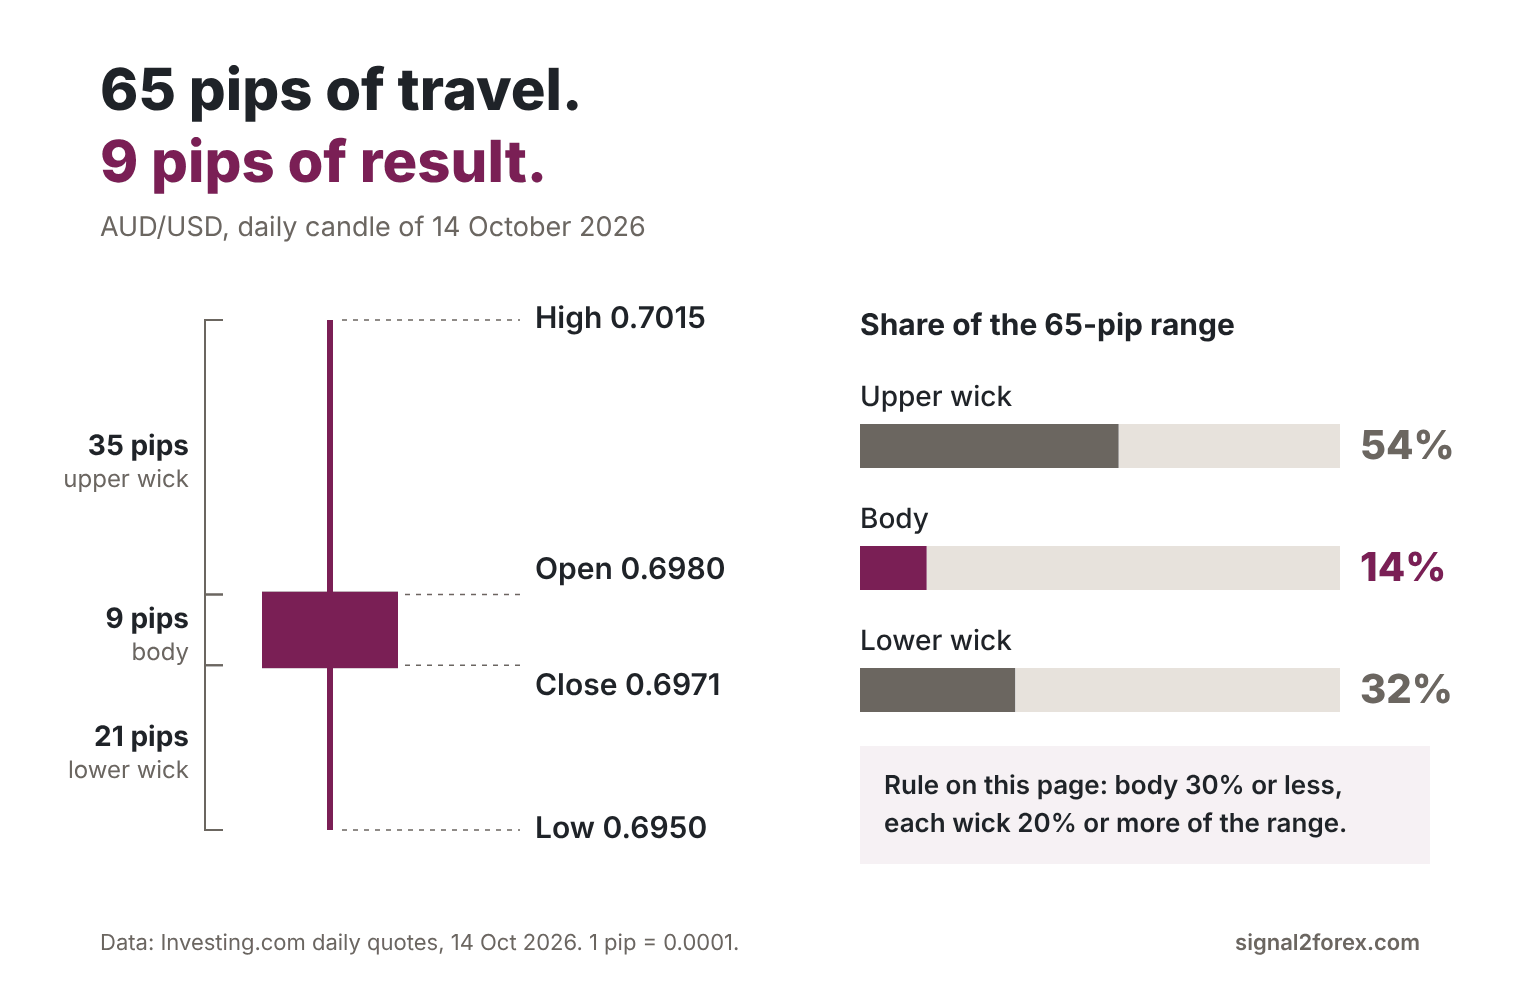
So the spinning top candlestick meaning is simple — a lot of movement and almost no result. Steve Nison brought candle charts to Western traders with his book Japanese Candlestick Charting Techniques. He describes the spinning top by its small real body, and he gives the length of the shadows less weight. I agree with him about the body. But small is a word, and a word is not enough for me.
Spinning top candlestick pattern rules
I write trading robots, and a robot cannot read the word small. I have to give it a number. So my rule for a spinning top candle has three lines — the body is 30% of the candle’s range or less, the upper wick is at least 20% of the range, and the lower wick is at least 20% too.
range = high - low;
body  = MathAbs(close - open);
upper = high - MathMax(open, close);
lower = MathMin(open, close) - low;
top   = body  <= 0.30 * range
     && upper >= 0.20 * range
     && lower >= 0.20 * range;
The first line — a small body. The second and third lines — two real wicks, so that a hammer does not pass the test. On 22 October the body was only 9 pips of 44, but the upper wick was 8 pips, less than 20%. This candle is closer to the hammer family than to a spinning top pattern, and my rule rejects it.
I do not know whether 30% is the best number. Some traders use 25%, some use a third, and nobody can prove one of them right. But a rule with a number can be tested on history, and a rule with the word small cannot. If you want to trust a spinning top candle pattern, you need to write it so that two people count the same candles.
What about the doji? In books on candlestick patterns spinning top and doji usually share one page, and the border between them is also a number. A doji has almost no body at all — the open and the close are the same price, or a pip or two apart. A spinning top doji is two names for one candle near that border. I describe the doji family in another article.
Red, black, white
Is a spinning top red or green? Does the colour change the forecast? Colour only says where the close is. A white or green spinning top closed above its open, and a black or red one closed below it. In MetaTrader 5 you choose these colours yourself in the chart settings, in the lines Bull candle and Bear candle.
So the black spinning top meaning is modest — sellers finished a few pips ahead. Look at 8 October in my table. The candle was black, with a body of 7 pips, and the next day AUD/USD rose 27 pips. Many guides call a white candle a bullish spinning top candlestick and a black one bearish. On my 21 candles the colour of a 7-pip body told me nothing about tomorrow.
Four candles in one month
Spinning top candlestick examples in books are drawn by hand, and they always work. Real ones behave less neatly. Here are all four from my count on one chart, each with the day that came after it.
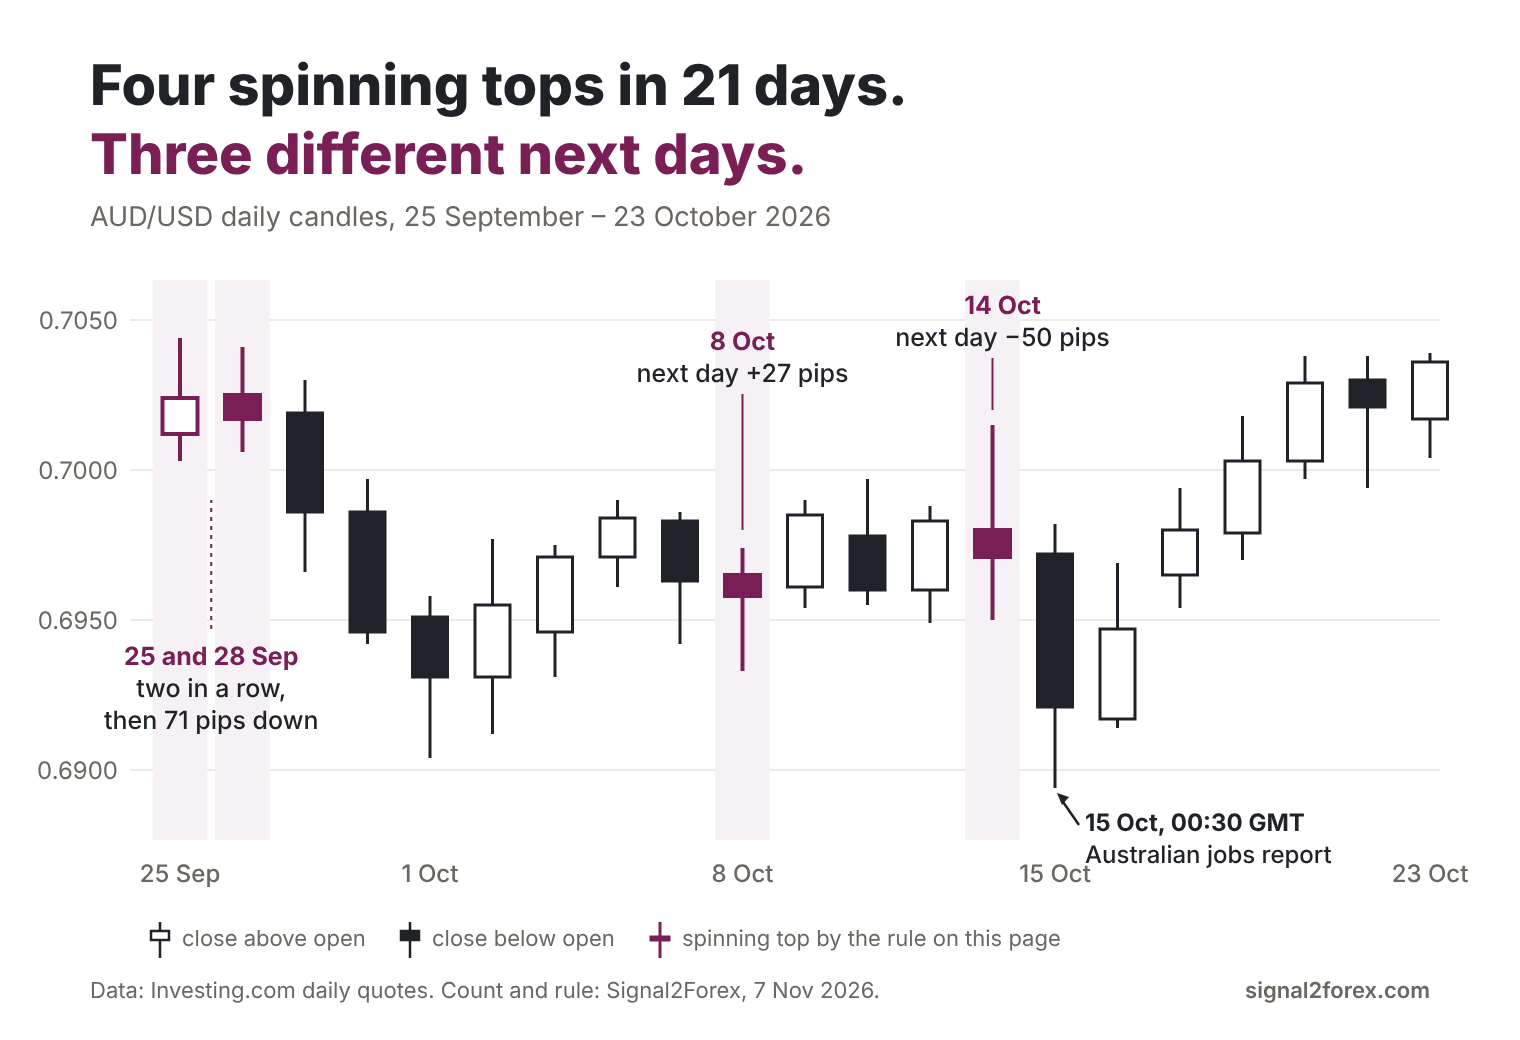
The first two came together, on 25 and 28 September. This is a double spinning top candlestick — two small bodies in a row. Before them AUD/USD had lost about 100 pips in two days. After them it lost 71 more, from 0.7017 to 0.6946 by 30 September. The pair marked a rest inside a fall, and then the fall went on.
The third one, on 8 October, sat in the middle of a quiet range between 0.6930 and 0.6990. It had a long lower wick of 25 pips. Price rose the next day and fell the day after. I have nothing more to say about it, and I think this is the usual case.
The fourth is the one I find most useful. On Wednesday 14 October the pair went up through 0.7000, came back and closed almost where it opened. Why did nobody win that day? The September jobs report from Australia was due at 00:30 GMT on Thursday, and large traders did not want to hold a big position before the number came out.
The Australian Bureau of Statistics then reported an unemployment rate of 4.7%. Employment fell by 39,300, while forecasts had pointed to a gain of about 20,000. Reuters wrote that the Australian dollar fell 0.3% to $0.6953 soon after the release. By the close of the day AUD/USD stood at 0.6921 — 50 pips lower.
Calendar before candle
Most guides give one rule for spinning top trading: wait for the next candle and follow it. I suppose it works sometimes. But on my count the price of 15 October moved because of a number from Canberra. The candle of the day before only showed that people were waiting.
So before I read a spinning candlestick as a signal, I open the economic calendar. If a rate decision or a jobs report is due in the next 24 hours, the small body has a simple reason. This check takes one minute.
There is one more detail that candle books skip. A daily candle depends on the clock of your broker’s server. Many MetaTrader brokers close the day at 17:00 New York time, and others close it at midnight GMT. The same Wednesday can be a spinning top on one server and an ordinary candle on another. For a robot this is the first thing to check on a new account.
One trade in dollars
Now the usual spinning candle trading plan, applied to 14 October. You place a sell order under the low of the candle, at 0.6950. You place the stop above its high, at 0.7015. The risk is 65 pips plus the spread. This is about $650 on one standard lot — 100,000 units — and $6.50 on a 0.01 lot.
On a $10,000 account a risk of 1% is $100, so the position is about 0.15 lot. On a $100 cent account 1% is $1, and the position is about 0.15 cent lot. The candle sets the size here. A wide spinning top means a wide stop, and a wide stop means a small position.
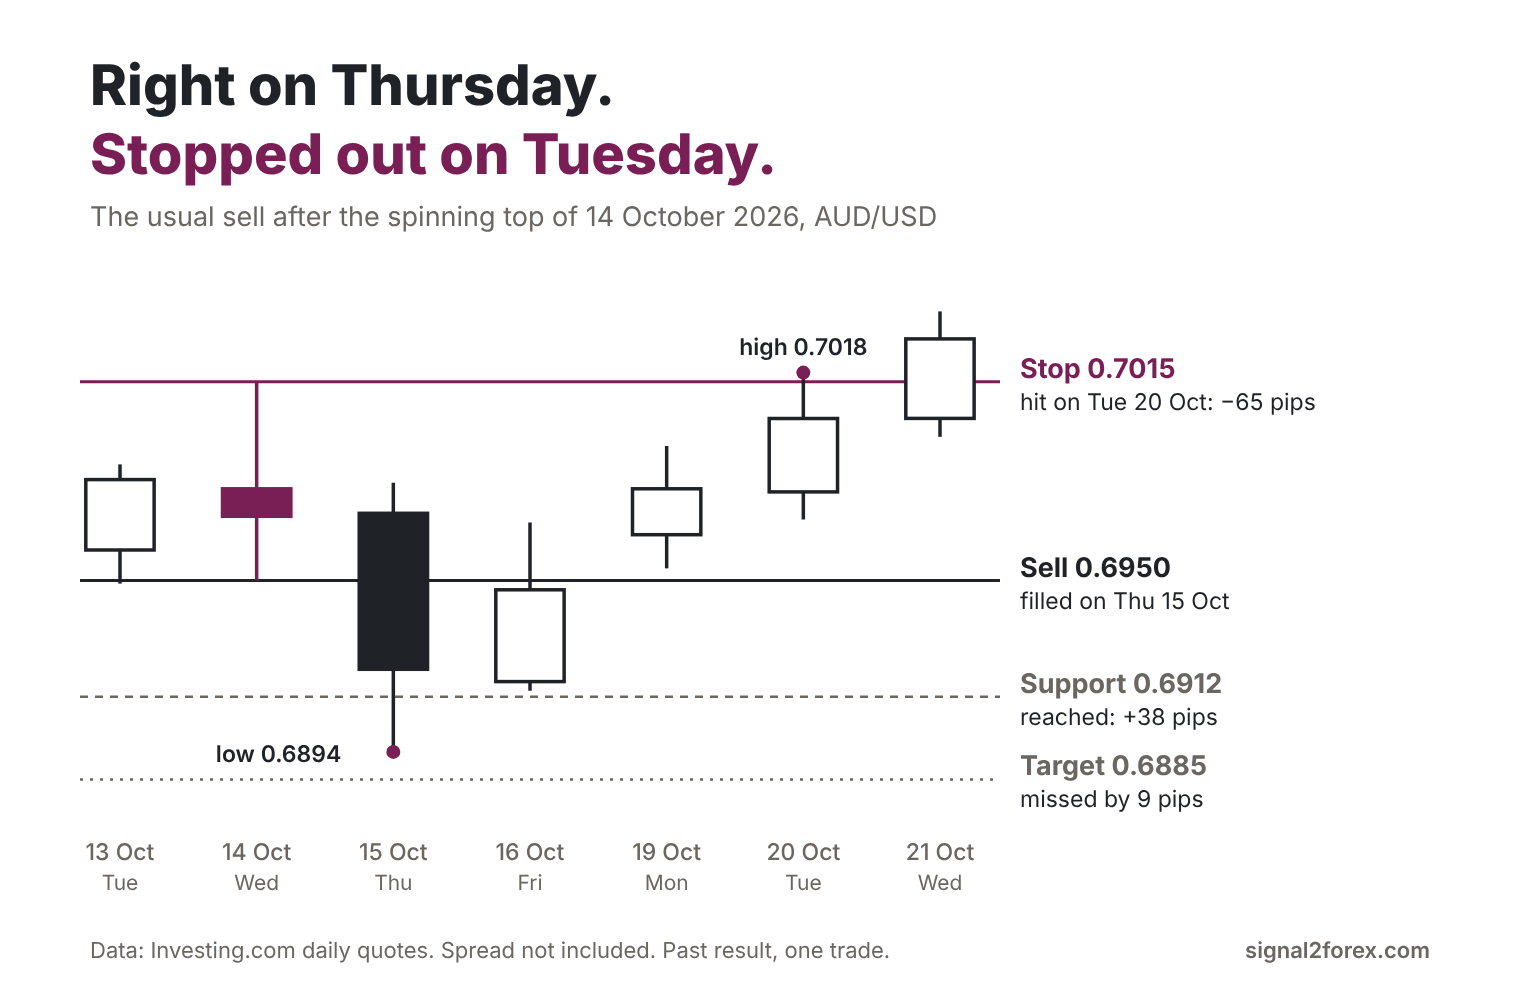
What happened next? The sell order was filled on Thursday after the jobs report. The low of the day was 0.6894, so the trade was 56 pips in profit at its best moment. A target equal to the risk stood at 0.6885, and price turned 9 pips before it. On Tuesday 20 October AUD/USD reached 0.7018, and the stop at 0.7015 was hit.
A trader with a closer target did better. The low of 2 October at 0.6912 was the nearest support, and price reached it on Thursday. This is a gain of 38 pips against a risk of 65 — about $380 against $650 on a standard lot, or $3.80 against $6.50 on a 0.01 lot. The pattern was right for one day. The plan around it decided the result.
Would I let a robot trade this candle alone? On this evidence, no. Four cases in 21 days are not statistics, and I do not know whether three falls out of four would hold on a year of data. The robots in my Forex V Portfolio work on one-hour charts of 14 pairs. For any rule there I want hundreds of cases in a backtest. This is one past trade, and the next one can end differently.
A pause with a reason
A spinning top candlestick pattern is a small body between two wicks, and the small body needs a number. Its colour says little. Its place says more — after a fall, inside a range, or one day before a report. The calendar explains many of these candles, the server clock changes some of them, and the width of the candle sets the stop and the size of the trade.
This candle is a pause, and a pause usually has a reason. The more of this you write down as numbers — the share of the body, the two wicks, the risk in dollars, the hour of the next release — the steadier your reading of this small candle becomes.
About the author. Uladzimir Leuchankou is the founder of Signal2Forex and the developer of the Forex V Portfolio. He is a software engineer with a BSc in Finance. The count of spinning tops on this page is his own. He made it on 7 November 2026 from 21 daily AUD/USD candles, with the three-line rule shown above. His real trading account runs as a live stream on YouTube. Corrections are welcome at forexfactory1shop@gmail.com.
Sources: Australian Bureau of Statistics, media release of 15 October 2026; Reuters, 15 October 2026; MetaTrader 5 Help, Chart Settings; Steve Nison, Japanese Candlestick Charting Techniques. Price data: Investing.com daily AUD/USD quotes, 25 September – 23 October 2026. Trading currencies with borrowed money can lose more than you expect. Nothing here is personal advice.


 Signal2forex.com - Best Forex robots and signals


