
📑 Table of Contents
- 1. What Is the Head and Shoulders Pattern?
- 2. What Is the Inverse Head and Shoulders Pattern?
- 3. How to Identify Head and Shoulders Patterns
- 4. Head and Shoulders vs Inverse Head and Shoulders
- 5. How to Trade the Head and Shoulders Pattern — Step by Step
- 6. Head and Shoulders Trading Checklist
- 7. How Reliable Is the Head and Shoulders Pattern?
- 8. Common Mistakes When Trading Head and Shoulders
- 9. Frequently Asked Questions
1. What Is the Head and Shoulders Pattern?
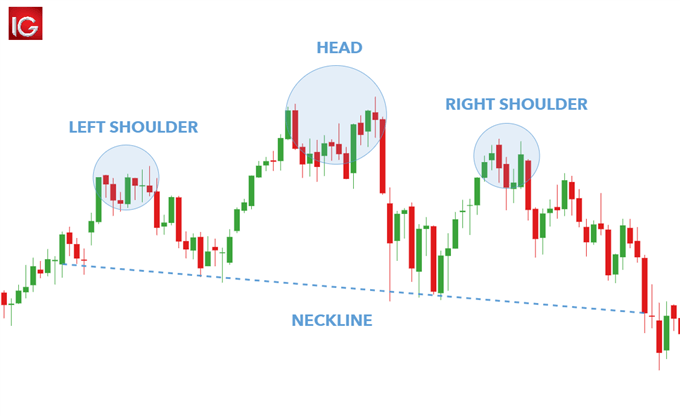
The head and shoulders pattern is a bearish reversal chart pattern that forms at the end of an uptrend. It signals that the trend is losing momentum and a reversal to the downside is likely. The pattern consists of three peaks: a left shoulder, a higher head, and a lower right shoulder, all connected by a neckline.
The head and shoulders pattern is widely regarded as one of the most reliable reversal patterns in technical analysis. It has been studied and traded for decades across all financial markets, including forex, stocks, indices, and commodities.
2. What Is the Inverse Head and Shoulders Pattern?
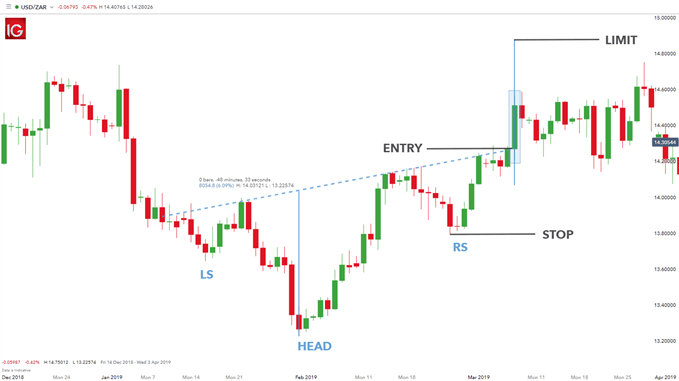
The inverse head and shoulders pattern is the opposite of the standard version. It forms at the end of a downtrend and signals a bullish reversal to the upside. It consists of three valleys: a left shoulder, a lower head, and a higher right shoulder, all connected by a neckline.
This pattern is equally important for traders as it provides early signals of trend reversals from bearish to bullish, offering opportunities to enter long positions at the beginning of a new uptrend.

3. How to Identify Head and Shoulders Patterns
Identifying a head and shoulders pattern requires a systematic approach. Use the following characteristics and checklist to confirm the pattern.
Key Characteristics of a Head and Shoulders Pattern
- Market Context: The pattern must form after a clear uptrend.
- Left Shoulder: A peak that forms after a moderate rise, followed by a pullback to the neckline.
- Head: A higher peak that forms after another rise, followed by a pullback to the neckline.
- Right Shoulder: A lower peak that forms after another rise, followed by a pullback to the neckline.
- Neckline: A trendline connecting the lows between the shoulders and the head. It can be horizontal, upward-sloping, or downward-sloping.
- Volume: Volume should be highest on the left shoulder, lower on the head, and lowest on the right shoulder. A spike in volume on the breakout confirms the pattern.
Head and Shoulders Pattern Checklist
- ✅ Identify existing uptrend
- ✅ Look for three distinct peaks with the middle peak (head) being the highest
- ✅ Ensure the shoulders are roughly equal in height
- ✅ Draw the neckline connecting the lows between the shoulders
- ✅ Confirm that volume is decreasing on the right shoulder
- ✅ Wait for price to break below the neckline for confirmation
4. Head and Shoulders vs Inverse Head and Shoulders
Understanding the differences between the standard and inverse head and shoulders patterns is essential for accurate identification and trading. The table below provides a clear comparison.
| Feature | Head and Shoulders | Inverse Head and Shoulders |
|---|---|---|
| Market Context | End of an uptrend | End of a downtrend |
| Formation | Three peaks: left shoulder, head (highest), right shoulder | Three valleys: left shoulder, head (lowest), right shoulder |
| Signal | Bearish reversal | Bullish reversal |
| Neckline | Connects the lows between shoulders | Connects the highs between shoulders |
| Entry | Break below neckline | Break above neckline |
| Stop-Loss | Above right shoulder | Below right shoulder |
| Take-Profit | Measured move (head to neckline distance) | Measured move (head to neckline distance) |
| Success Rate | ~60-85% | ~60-85% |
📌 Success Rate is based on historical performance when confirmed with additional indicators. Higher timeframes (daily, weekly) tend to be more reliable.
5. How to Trade the Head and Shoulders Pattern — Step by Step
Trading the head and shoulders pattern requires a disciplined approach. Follow these six steps to maximise your chances of success.
Step 1 — Identify a Valid Pattern
- Ensure the pattern forms after a clear uptrend (for standard) or downtrend (for inverse).
- Confirm the three peaks/valleys with the head being distinctly higher (standard) or lower (inverse).
- Verify that the shoulders are roughly equal in height.
Step 2 — Draw the Neckline
- Draw a trendline connecting the lows between the shoulders (standard) or the highs between the shoulders (inverse).
- The neckline can be horizontal, upward-sloping, or downward-sloping.
Step 3 — Wait for Breakout Confirmation
- Wait for price to break through the neckline with a decisive candle close.
- Look for increasing volume on the breakout to confirm the signal.
- A retest of the neckline after the breakout can provide a secondary entry opportunity.
Step 4 — Entry Rules
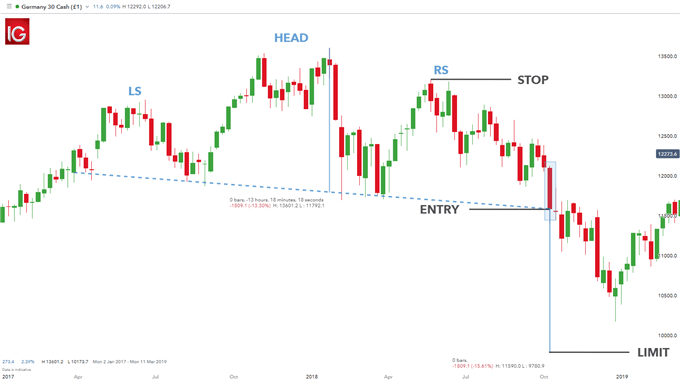
- Head and Shoulders: Enter a short position on a break below the neckline.
- Inverse Head and Shoulders: Enter a long position on a break above the neckline.
- Alternative Entry: Some traders wait for a retest of the neckline before entering.
Step 5 — Stop-Loss Placement
- Head and Shoulders: Place stop-loss above the right shoulder.
- Inverse Head and Shoulders: Place stop-loss below the right shoulder.
- Buffer: Add a small buffer beyond the right shoulder to account for market noise.
- Risk Management: Never risk more than 1–2% of your trading account on a single trade.
Step 6 — Take-Profit Targets (Measured Move)
- Calculate the measured move: measure the vertical distance from the head to the neckline.
- Head and Shoulders: Project that distance downward from the breakout point.
- Inverse Head and Shoulders: Project that distance upward from the breakout point.
- Risk-Reward: Aim for a minimum risk-reward ratio of 1:2.
6. Head and Shoulders Trading Checklist
Before entering a trade based on the head and shoulders pattern, run through this static checklist to ensure you have covered all the key criteria.
| Step | Check | Status |
|---|---|---|
| 1 | Is there a clear uptrend (standard) or downtrend (inverse)? | ☑ Check |
| 2 | Are the three peaks/valleys clearly defined (shoulders roughly equal)? | ☑ Check |
| 3 | Is the head distinctly higher (standard) or lower (inverse)? | ☑ Check |
| 4 | Is the neckline clearly drawn (horizontal preferred but not obligatory)? | ☑ Check |
| 5 | Is volume decreasing on the right shoulder (standard) or increasing on breakout? | ☑ Check |
| 6 | Has the price broken through the neckline with confirmation? | ☑ Check |
| 7 | Is the risk-reward ratio at least 1:2? | ☑ Check |
| 8 | Have you set stop-loss above (standard) or below (inverse) the right shoulder? | ☑ Check |
📌 Status indicates that each step should be verified before entering a trade. Missing any of these steps increases the risk of a losing trade.
7. How Reliable Is the Head and Shoulders Pattern?
The reliability of the head and shoulders pattern depends significantly on the timeframe, market context, and confirmation signals. Here are the key statistics:
- Success Rate: The head and shoulders pattern has a success rate of approximately 60-85% depending on market conditions, timeframe, and confirmation signals.
- Higher Timeframes: The pattern is more reliable on daily, weekly, or 4-hour charts than on lower timeframes.
- Volume Confirmation: When confirmed by decreasing volume on the right shoulder and increasing volume on the breakout, reliability increases significantly.
- Neckline Slope: A steeper neckline tends to produce more powerful breakouts.
- Trend Context: The pattern is most reliable when it forms after a prolonged uptrend (standard) or downtrend (inverse).
💡 Trading tip: Never rely solely on the head and shoulders pattern. Always use it in combination with other technical tools such as volume analysis, trendlines, and support/resistance levels.
8. Common Mistakes When Trading Head and Shoulders
Avoid these common pitfalls to improve your success rate with head and shoulders patterns.
- ❌ Trading the pattern in isolation: Head and shoulders patterns require confirmation from volume and other technical indicators.
- ❌ Ignoring the overall trend: The pattern is most reliable when it forms after a prolonged trend.
- ❌ Entering too early: Entering before the neckline is broken can lead to losses if the pattern fails.
- ❌ Placing stop-loss too tight: Setting the stop-loss too close to the entry can result in being stopped out by normal market noise.
- ❌ Ignoring volume: Low volume on the breakout reduces the reliability of the signal.
- ❌ Confusing the pattern with a double top: A double top has only two peaks, while a head and shoulders has three peaks with the middle being the highest.
9. Frequently Asked Questions
What is the head and shoulders pattern in trading?
The head and shoulders pattern is a bearish reversal chart pattern that forms at the end of an uptrend. It consists of three peaks: a left shoulder, a higher head, and a lower right shoulder, connected by a neckline.
What is the inverse head and shoulders pattern?
The inverse head and shoulders pattern is the opposite of the standard version. It forms at the end of a downtrend and signals a bullish reversal. It consists of three valleys with the middle valley (head) being the lowest.
How do you identify a head and shoulders pattern?
Look for a clear uptrend, three distinct peaks with the middle peak (head) being the highest, shoulders roughly equal in height, and a neckline connecting the lows between the shoulders. Volume should decrease on the right shoulder.
How do you trade a head and shoulders pattern?
Enter a short position when price breaks below the neckline with confirmation (e.g., a candle close below the neckline). Place stop-loss above the right shoulder and set take-profit using the measured move technique.
What is the measured move in head and shoulders?
The measured move is a technique for setting profit targets. Calculate the vertical distance from the head to the neckline, then project that distance downward from the breakout point (for standard pattern) or upward (for inverse pattern).
How reliable is the head and shoulders pattern?
The head and shoulders pattern has a success rate of approximately 60-85% depending on market conditions, timeframe, and confirmation signals. Higher timeframes and volume confirmation increase reliability.
What is the difference between head and shoulders and inverse head and shoulders?
The head and shoulders pattern forms at the top of an uptrend and signals a bearish reversal. The inverse head and shoulders forms at the bottom of a downtrend and signals a bullish reversal. They are mirror images of each other.
Where should I place my stop-loss in a head and shoulders trade?
For a standard head and shoulders pattern, place your stop-loss above the right shoulder. For an inverse pattern, place it below the right shoulder. This protects you if the pattern fails.
Can the head and shoulders pattern be used in forex trading?
Yes, the head and shoulders pattern is widely used in forex trading and works on any timeframe. It is equally effective in forex, stocks, indices, and commodities markets.
🌍 Expand your trading opportunities: Learn how to trade the top 5 emerging market currencies — how to trade them. Emerging market currencies often form strong head and shoulders patterns, and understanding their unique characteristics can help you identify high-probability setups in these volatile markets.
📚 Understand the foundation of modern trading: Discover the history of forex — from the gold standard to modern electronic trading. Understanding how the forex market evolved helps traders appreciate why patterns like head and shoulders have remained reliable across decades of market history.
📞 Need help with your head and shoulders trading strategy? Our team is here to assist you. Visit our Contact Page or use the online chat available on every page of our website for immediate support.



 Signal2forex.com - Best Forex robots and signals


