
Bear Pennant Pattern: Complete Trading Guide
📑 Table of Contents
- 1. What Is a Bear Pennant Pattern?
- 2. Bear Pennant vs. Bullish Pennant — Key Differences
- 3. How to Identify a Bearish Pennant Pattern
- 4. Bear Pennant Trading Strategy — Entry, Stop‑Loss & Take‑Profit
- 5. Pennant Pattern vs. Flag Pattern — What’s the Difference?
- 6. Common Mistakes When Trading Bear Pennants
- 7. Bullish Pennant Pattern — The Opposite Side
- 8. Frequently Asked Questions
1. What Is a Bear Pennant Pattern?
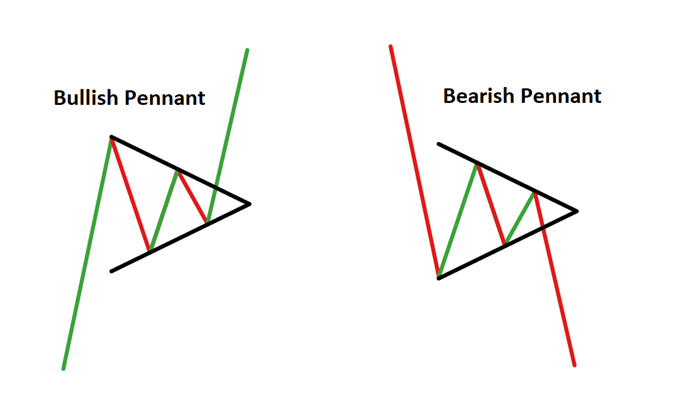
A bear pennant pattern is a bearish continuation chart pattern that forms after a sharp downward price move (the flagpole), followed by a brief consolidation period (the pennant), and then a breakout to the downside. It is one of the most reliable continuation patterns in technical analysis, with a success rate of approximately 70–80% when confirmed by volume.
The pattern gets its name from its shape — a small symmetrical triangle (the pennant) attached to a vertical pole (the flagpole). This visual resemblance to a pennant flag makes it easy to identify once you know what to look for.
✅ Key strength: The bear pennant provides clear entry and exit levels, making it a favourite among both novice and experienced traders.
❌ Key weakness: Like all patterns, it can fail — especially in choppy or range‑bound markets where false breakouts are common.
2. Bear Pennant vs. Bullish Pennant — Key Differences
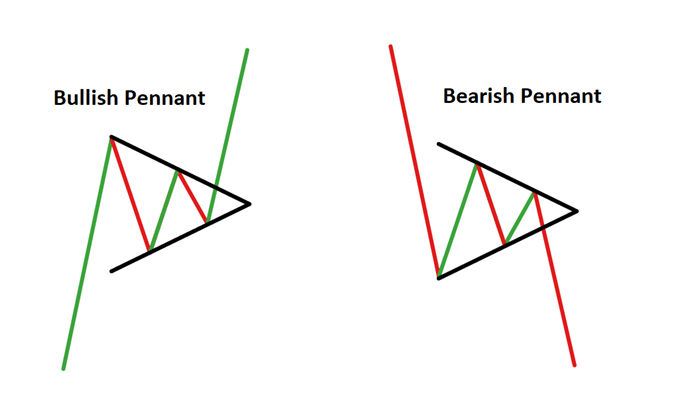
While both patterns share the same structure — flagpole, consolidation, and breakout — the direction of the trend and the breakout determine whether it is bearish or bullish. The table below summarises the key differences.
| Feature | Bear Pennant (Bearish) | Bullish Pennant |
|---|---|---|
| Trend Direction | Downtrend | Uptrend |
| Flagpole | Sharp downward move | Sharp upward move |
| Consolidation Shape | Symmetrical triangle (narrowing) | Symmetrical triangle (narrowing) |
| Breakout Direction | Below lower trendline | Above upper trendline |
| Volume During Flagpole | High (selling pressure) | High (buying pressure) |
| Volume During Pennant | Decreasing | Decreasing |
| Volume at Breakout | Increasing (confirmation) | Increasing (confirmation) |
| Entry Signal | Short position | Long position |
| Stop‑Loss Placement | Above pennant high | Below pennant low |
| Take‑Profit Target | Measured move (flagpole length) | Measured move (flagpole length) |
| Typical Duration | 1–3 weeks | 1–3 weeks |
| Reliability | ~70–80% | ~70–80% |
📌 Reliability refers to the percentage of time the pattern successfully continues in the expected direction. Volume confirmation is critical for both patterns.

3. How to Identify a Bearish Pennant Pattern
Identifying a bearish pennant requires attention to four key stages. Missing any of these steps can lead to false signals and losing trades.
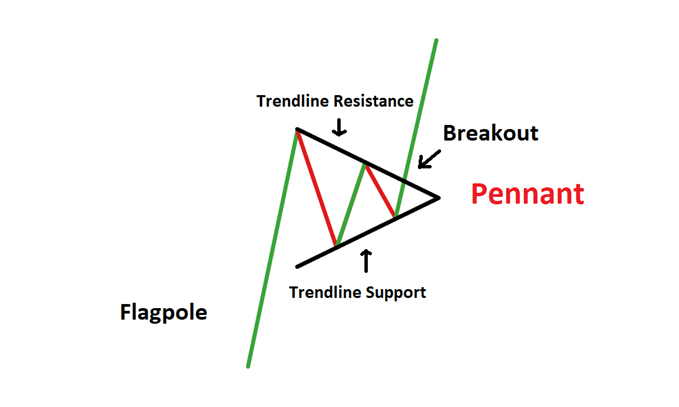
Step 1 — Flagpole (Sharp Downward Move)
The pattern begins with a sharp, impulsive downward move — the flagpole. This move should be steep and accompanied by high volume, indicating strong selling pressure. The flagpole can be any length, but the longer and steeper it is, the more significant the pattern tends to be.
Step 2 — Consolidation (The Pennant)
After the flagpole, price enters a consolidation phase where it trades in a narrowing range. This forms the pennant — a small symmetrical triangle with converging trendlines. During this phase, volume typically decreases as the market takes a breather.
Step 3 — Breakdown (Breakout Below Support)
The pattern completes when price breaks below the lower trendline of the pennant. This breakout should be decisive — a strong candlestick that closes below the trendline. The longer the consolidation, the more powerful the breakout tends to be.
Step 4 — Volume Confirmation
💡 Critical: The breakout must be accompanied by a surge in volume. Without increasing volume, the breakout is suspect and may result in a false signal. Volume is the fuel that confirms the pattern’s validity.
4. Bear Pennant Trading Strategy — Entry, Stop‑Loss & Take‑Profit
Once you have identified a valid bearish pennant, the next step is to execute the trade with a clear plan. Here is a step‑by‑step strategy.
Entry Rules for Bearish Pennants
- Entry Signal: Enter a short position when price breaks below the lower trendline of the pennant with a strong bearish candlestick.
- Alternative Entry: Some traders wait for a retest of the broken trendline (now resistance) before entering.
- Confirmation: Ensure that volume is increasing on the breakout candle.
Where to Place Your Stop‑Loss
- Stop‑Loss Placement: Place your stop‑loss above the highest point of the pennant (the upper trendline).
- Buffer: Add a small buffer above the pennant high to account for market noise and avoid being stopped out prematurely.
- Risk Management: Never risk more than 1–2% of your trading account on a single trade.
Take‑Profit Targets (Measured Move)
- Primary Target: Measure the length of the flagpole (from the start of the move to the beginning of the pennant) and project it downward from the breakout point.
- Secondary Target: For stronger trends, you can extend the target to 1.5× or 2× the flagpole length.
- Trailing Stop: Consider using a trailing stop to capture additional profits if the trend continues strongly.
Real Trading Example (with numbers)
Suppose EUR/USD drops sharply from 1.1200 to 1.1000 (flagpole = 200 pips). Price then consolidates between 1.1000 and 1.1050 for several days, forming a pennant. When price breaks below 1.0980 with high volume, you enter a short position. Your stop‑loss is placed above the pennant high at 1.1060 (risk = 80 pips). Your take‑profit target is the flagpole length (200 pips) projected downward from the breakout: 1.0980 − 0.0200 = 1.0780. This gives you a risk‑reward ratio of approximately 1:2.5.
5. Pennant Pattern vs. Flag Pattern — What’s the Difference?
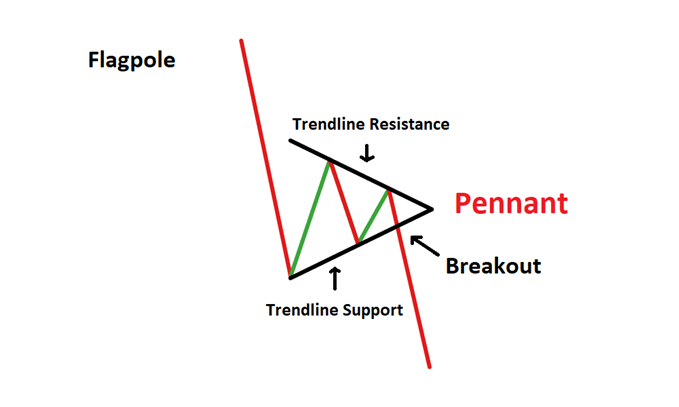
Pennant and flag patterns are often confused because they both form after sharp moves and signal continuation. However, there are distinct differences that every trader should know.
| Feature | Pennant Pattern | Flag Pattern |
|---|---|---|
| Shape | Small symmetrical triangle | Small parallelogram or rectangle |
| Trendlines | Converging | Parallel |
| Duration | 1–3 weeks | 3–6 weeks |
| Breakout Strength | Stronger (tighter consolidation) | Moderate |
| Volume Pattern | Decreases during pennant, surges at breakout | Decreases during flag, surges at breakout |
📌 The key differentiator is the shape — pennants have converging trendlines (triangles), while flags have parallel trendlines (rectangles).
6. Common Mistakes When Trading Bear Pennants
Even experienced traders make mistakes. Avoid these common pitfalls to improve your success rate with bear pennant patterns.
- ❌ Entering too early: Entering before the breakout is confirmed can lead to losses if the pattern fails.
- ❌ Ignoring volume: A breakout without volume confirmation is a red flag. Always wait for volume to surge.
- ❌ Placing stop‑loss too tight: Pennants can have minor wicks that trigger tight stops. Give your trade enough room.
- ❌ Trading in choppy markets: Pennant patterns work best in trending markets. Avoid them in range‑bound conditions.
- ❌ Overlooking the flagpole: A weak or shallow flagpole reduces the pattern’s reliability. Ensure the initial move was impulsive.
7. Bullish Pennant Pattern — The Opposite Side
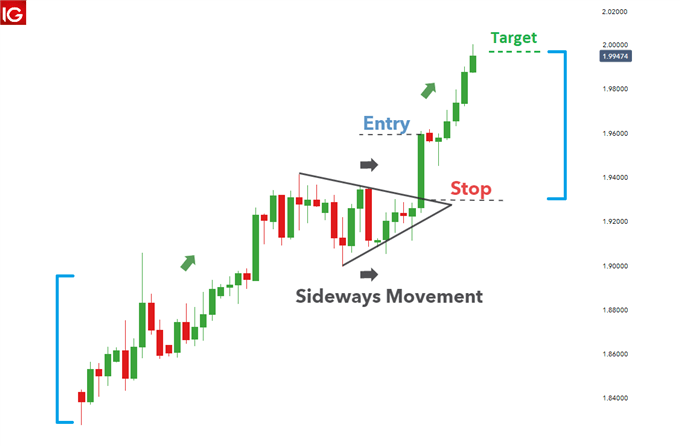
While this guide focuses on the bearish pennant, it is equally important to understand its bullish counterpart. A bullish pennant forms in an uptrend and signals a continuation to the upside. The structure is identical — a sharp upward move (flagpole), a consolidation period (pennant), and a breakout above the upper trendline with increasing volume.
Traders look to enter long positions on the breakout, with a stop‑loss below the pennant low and a take‑profit target equal to the flagpole length projected upward. The same rules of volume confirmation and trend context apply.
8. Frequently Asked Questions
What is a bear pennant pattern?
A bear pennant is a bearish continuation chart pattern that forms after a sharp downward price move (flagpole), followed by a brief consolidation period (pennant), and then a breakout to the downside.
How do you trade a bearish pennant?
Enter a short position when price breaks below the pennant’s lower trendline with increasing volume. Place a stop‑loss above the pennant’s high and set a take‑profit target equal to the flagpole’s length.
What is the difference between a pennant and a flag pattern?
A pennant has converging trendlines forming a symmetrical triangle, while a flag has parallel trendlines forming a small parallelogram or rectangle.
How reliable is the bear pennant pattern?
Technical analysis research shows pennant patterns have approximately 70–80% reliability in the expected continuation direction when confirmed by volume.
What role does volume play in a bear pennant?
Volume is typically high during the flagpole, decreases during the pennant consolidation, and then surges again at the breakout — confirming the pattern’s validity.
What is the typical timeframe for a pennant pattern?
Pennant patterns are short‑term patterns that usually complete within one to three weeks.
Can the bear pennant pattern fail?
Yes, like all chart patterns, bear pennants can fail. Common failure scenarios include: the flagpole wasn’t impulsive (choppy selloff), volume expands during consolidation (accumulation, not pause), or the pattern forms in a ranging market.
📌 Expand your trading knowledge: Learn how to trade top 5 emerging market currencies — these high‑volatility pairs often form powerful pennant patterns that can be traded for substantial profits.
🤖 Automate your trading: Download our free Moving Average Expert Advisor (EA) — a powerful tool that can help you identify trend continuations and manage your trades automatically, including pennant breakouts.



 Signal2forex.com - Best Forex robots and signals


