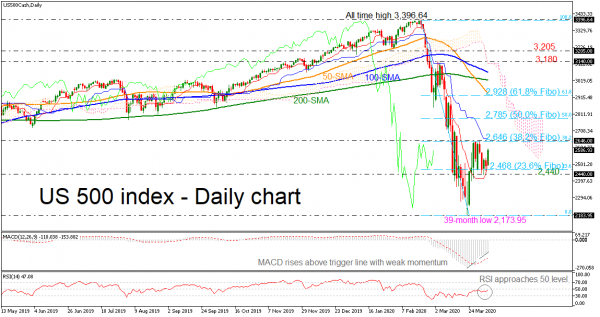
The US 500 cash index has been developing within a narrow range over the last two weeks with upper boundary the 38.2% Fibonacci retracement level of the down leg from 3,396.64 to 2,173.95 at 2,646 and lower boundary the 2,440 support level.
The momentum indicators are pointing to a neutral to positive bias in the short term, suggesting the possibility of an upside reversal. The RSI is just below 50 and the MACD oscillator is heading north above its trigger line, though with weak momentum.
In the event of an upside reversal, the 38.2% Fibonacci at 2,646 could act as a barrier before being able to re-challenge the 50% Fibonacci retracement level around the 2,785 hurdle inside the Ichimoku cloud. A break above this level would shift the medium-term outlook to a more neutral one as it would take the index towards the 61.8% Fibonacci of 2,928, which coincides with the 50-day simple moving average (SMA).
Further losses should see the immediate support level at 2,468, which is the 23.6% Fibo and stands near the 2,440 barrier. A fall below these levels would reinforce the bearish structure in the short-term and open the way towards the next key support of the 39-month trough of 2,173.95.
Turning to the medium-term picture, the market seems to be in bearish mode given that the index is trading below the SMAs, as long as the bearish cross between the 50- and the 200-day SMA remains intact.


 Signal2forex.com - Best Forex robots and signals


