During today’s Asian session, Japan’s Prime Minister Shinzo Abe and his cabinet approved another ¥117T (USD $1.1T) stimulus package including subsidies to help firms pay rent, financing help for struggling companies, support for local economies, and health care assistance. This agreement matches the country’s stimulus package from April, bringing the combined total to a whopping 40% of Japan’s GDP as the country tries to limit the long-term fallout from an expected -20%+ GDP decline this quarter.
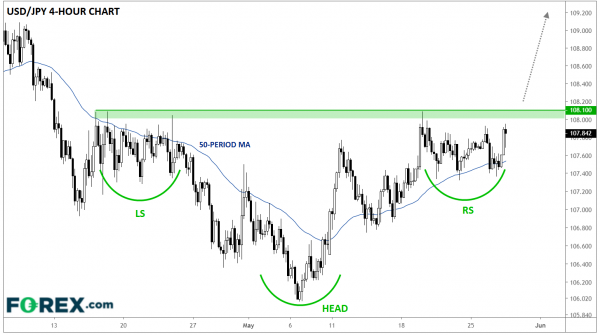
In what’s become the typical response to Japan’s incomprehensibly massive stimulus measures, FX traders mostly shrugged off the developments as “more of the same” from the developed world’s most heavily-indebted developed country. As of writing, USD/JPY is trading up slightly on the day to reapproach key resistance at its 6-week high near 108.00:
Source: TradingView, GAIN Capital
As the chart above shows, the 108.10 level represents the “neckline” of an inverted head-and-shoulders pattern. For the uninitiated, this pattern shows a transition from a textbook downtrend (lower highs and lower lows) to an uptrend (higher highs and higher lows) and is often seen at significant bottoms in the market.
That said, the pattern will not be confirmed until/unless rates can break above the 108.10 level. If we do see that bullish development, readers could consider bullish trades, with the potential for a “measured move” rally up toward 110.00 in time, though the early April high at 109.35 (not shown) may also serve as resistance. On the other hand, a drop below Friday’s low at 107.35 would invalidate the setup and point toward a deeper drop to the upper-106.00s or lower.


 Signal2forex.com - Best Forex robots and signals


