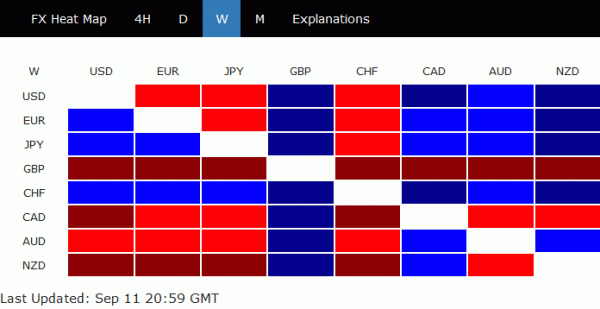
Sterling’s selloff was the most decisive move last week. UK-EU negotiations seemed heading to a dead-end as UK published the so-called internal market bill, which violates part of the Brexit Withdrawal Agreement. WTO style of trade relationship after Brexit looks more likely than ever. Technical developments in Sterling pairs suggest that weakness would persist for the near- or even the medium-term.
Swiss Franc and Yen ended as the strongest ones last week, with some help from selloff in the stock markets. In particular, it now looks like NASDAQ is ready for a deeper correction to digest the strong up trend since March. Euro and Dollar were mixed. ECB President Christine Lagarde refrained from sounding too concerned with Euro’s appreciations. That kept EUR/USD in range. Dollar’s next move, would now depend on overall risk sentiments, than the common currency.
GBP/CHF could be resuming long term down trend
GBP/CHF’s decline from 1.2222 accelerated to as low as 1.1598 last week and breached 1.1630 support. Near term focus will now be on 61.8% retracement of 1.1102 to 1.2259 at 1.1544. Firm break of 1.1544 will in turn suggest that rebound from 1.1102 has completed. Larger down trend is ready to resume, after rejection by 55 week EMA. GBP/CHF could drop through 1.1102 to 61.8% projection of 1.5570 to 1.1701 from 1.3310 at 1.0919.


GBP/AUD resumed fall from 2.0854
GBP/AUD resumed the decline from 2.0854 through 1.7694. The rejection by 55 day EMA is a clear indication of near term bearishness Further decline should now be seen to 61.8% projection of 2.0854 to 1.7694 from 1.8411 at 1.6458. Also, the structure of the rise from 1.5626 (2016 low) to 2.0854 argues that it’s more likely a corrective move then not. Hence, fall from 2.0854 might indeed be the third leg of the pattern from 2.2382 (2015 high). If that’s true, break of 1.5626 low should eventually be seen down the road.


GBP/CAD less bearish, but still vulnerable
GBP/CAD’s development was less bearish then the above two. Still, downside acceleration last week argues that consolidation pattern from 1.6542 has completed at 1.7674. Fall from 1.8052 might be ready to resume. Near term focus will be on 1.6750 support. Sustained break there will affirm this case and push GBP/CAD through 1.6542 support. Note that GBP/CAD has been trading in a consolidation pattern since hitting 1.5746 in 2016. Firm break of 1.6542 should at least bring a test of 1.5746/5875 support zone., with risk of break through to resume the down trend form 2.0971 (2015 high).


Dollar index and NASDAQ might finally confirm correction
As for Dollar index, the rebound attempt this month has been disappointing so far. ECB’s refrain from raising strong concern over Euro strength was a factor limiting the DXY. Still, the conditions for a correction to fall from 102.99 to 91.74 are set, with breach of channel resistance, as well as mild bullish convergence condition in daily MACD. Break of last week high of 93.66 should pave the way to 38.2% retracement of 102.99 to 91.74 at 96.03.

If that happens, resurgence of risk aversion would likely be the reason. In particular, NASDAQ breached an important support zone of 55 day EMA, and 23.6% retracement of 6631.42 to 12074.06. Another round of selloff this week would send NASDAQ to 38.2% retracement at 9994.97. That should be accompanied by the above envisaged rebound in DXY if happens.

EUR/GBP surged to as high as 0.9291 last week. The firm break of 0.9175 confirmed resumption of whole rise from 0.8670. Initial bias remains on the upside this week for 100% projection of 0.8670 to 0.9175 from 0.8866 at 0.9371 first. Break will target 0.9499 high next. On the downside, below 0.9210 minor support will turn intraday bias neutral and bring consolidations first, before staging another rally.

In the bigger picture, at this point, we’re still seeing the fall from 0.9499 as developing into a corrective pattern. That is, up trend form 0.6935 (2015 low) would resume at a later stage. This will remain the favored case as long as 0.8276 support holds. Decisive break of 0.9499 will target 0.9799 (2008 high).

In the long term picture, rise from 0.6935 (2015 low) is still in progress. It could be resuming long term up trend from 0.5680 (2000 low). Break of 0.9799 (2008 high) is expected down the road, as long as 0.8276 support holds.


 Signal2forex.com - Best Forex robots and signals


