
IG Client Sentiment (IGCS) is one of the most powerful contrarian indicators in forex trading. This guide explains what IGCS is, how to read the sentiment report, and exactly how to trade against the crowd — plus a static reference table to sharpen your entries.
1. What Is IG Client Sentiment (IGCS)?
IG Client Sentiment (IGCS) is a proprietary sentiment indicator provided by IG Group, one of the world’s largest retail forex brokers. It shows the percentage of IG clients who are net-long or net-short on a given currency pair or other financial instrument.
Unlike technical indicators that rely on price or volume data, IGCS is a behavioural indicator that tracks the actual positions of real traders. This makes it a powerful window into retail trader psychology.
How IGCS Works
- Data Source: Real positions of IG clients on live trading accounts
- Metric: Percentage of long vs short positions for each instrument
- Update Frequency: Real-time, updated continuously throughout the trading day
- Coverage: Forex, commodities, cryptocurrencies, stock indices, and more
Where to Find IG Client Sentiment Data
- Official IG Group website — ig.com
- IG trading platforms (web, mobile, MT4)
- Third-party sentiment aggregators and forex news sites

Fig 1: IG Client Sentiment interface — real-time positioning data for major currency pairs.
2. Why IGCS Is a Contrarian Indicator
IG Client Sentiment is considered a contrarian indicator because retail traders tend to be wrong at key market turning points. The crowd often buys at tops and sells at bottoms.
The Psychology of Retail Traders
- Most retail traders lack discipline and trade with emotion
- They tend to chase trends and buy after big moves
- They panic sell at market bottoms
- They have poor risk management, making them vulnerable to large moves
How to Read Sentiment Extremes
- Bullish signal: When 60%+ of traders are net-short
- Bearish signal: When 60%+ of traders are net-long
- Extreme signal: When 80%+ are in one direction
| Sentiment | % Long | % Short | Signal | Action |
|---|---|---|---|---|
| Extreme Bullish | 80%+ | 20%- | 🔻 Bearish | Consider Short |
| Extreme Bearish | 20%- | 80%+ | 🔺 Bullish | Consider Long |
| Moderate Bullish | 60–79% | 21–40% | ⚠️ Caution | Wait for confirmation |
| Moderate Bearish | 21–40% | 60–79% | ⚠️ Caution | Wait for confirmation |
| Neutral | 40–60% | 40–60% | ➖ Neutral | Range trading |
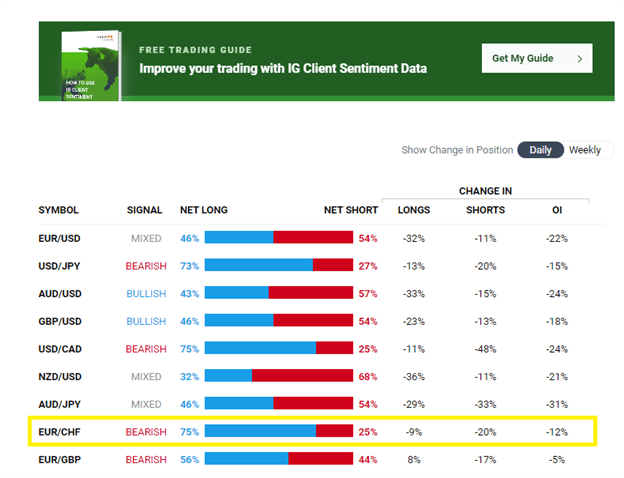
Fig 2: IGCS extreme readings — 75% long signals a bearish contrarian opportunity.
3. How to Read the IG Client Sentiment Report
Net-Long vs Net-Short Percentages
The IGCS report shows the percentage of clients who are net-long (buyers) vs net-short (sellers) for each instrument. The sum of long and short percentages typically equals 100% (excluding clients with no position).
Daily and Weekly Changes (IGCS Delta)
Changes in net positioning, known as the IGCS delta, can be powerful short-term signals:
- Daily change: How much the long percentage changed in the last 24 hours
- Weekly change: How much the long percentage changed over the last week
- Interpretation: A sharp change indicates a potential sentiment shift
Client Positioning Charts
The positioning chart visually displays the percentage of long vs short positions, often overlaid with price action to spot divergences.

Fig 3: IGCS positioning chart for EUR/USD — net-long vs net-short with daily changes.
4. IGCS Trading Strategies
Strategy #1 — Contrarian Reversal Trading
- Signal: 60%+ of traders positioned in one direction
- Action: Trade in the opposite direction of the crowd
- Confirmation: Wait for a reversal candlestick or breakout of a key level
- Example: 75% long on EUR/CHF → bearish signal
Strategy #2 — Trend Confirmation with IGCS Delta
- Signal: IGCS delta changes confirm the current trend
- Action: Use delta to confirm or reject potential entries
- Example: Rising short positions may signal a market bottom
Strategy #3 — Combining IGCS with Technical Analysis
- Signal: IGCS signal + technical analysis confirmation
- Tools: Trendlines, moving averages, MACD
- Example: Bearish IGCS + price below 50 & 200 MA + MACD below zero = strong sell signal
Strategy #4 — Sentiment Divergence Trading
- Signal: Divergence between price and sentiment
- Action: Price continues in a trend while sentiment reaches an extreme → potential reversal
- Example: Price in uptrend but sentiment reaches 80% long → bearish divergence
| Strategy | Entry Signal | Stop-Loss | Take-Profit |
|---|---|---|---|
| Contrarian Reversal | 60%+ extreme + confirmation candle | Beyond recent S/R level | Next S/R level |
| Trend Confirmation | IGCS delta + technical alignment | Below/above trendline | Trail with trend |
| Divergence Trading | Price/sentiment divergence + reversal pattern | Beyond wick extreme | Opposite extreme |

Fig 4: Contrarian trading strategy — entering against extreme sentiment with confirmation.
Fig 5: Sentiment divergence — price trending up while long % reaches extreme levels.
5. Real-World Examples (2026)
Example 1 — EUR/USD Contrarian Signal
On the daily chart, EUR/USD approached resistance at 1.0950. IGCS showed 74% of clients net-long — an extreme contrarian signal. The price formed a Shooting Star at resistance, confirming the bearish signal. Price declined ~150 pips over the next 4 days.
- Entry: 1.0930 (on confirmation candle)
- Stop-loss: 1.0980 (above resistance and wick)
- Take-profit: 1.0780 (next support level)
- Risk/Reward: ~1:3
Example 2 — GBP/JPY Sentiment Divergence
GBP/JPY was in a strong uptrend, but IGCS showed 82% of clients net-short — extremely bearish positioning. Despite the extreme sentiment, price continued higher, creating a bullish divergence. The short squeeze pushed price up another 200 pips.
- Entry: 191.50 (on break of resistance)
- Stop-loss: 190.80 (below recent support)
- Take-profit: 193.50 (next resistance level)
- Risk/Reward: ~1:2.5
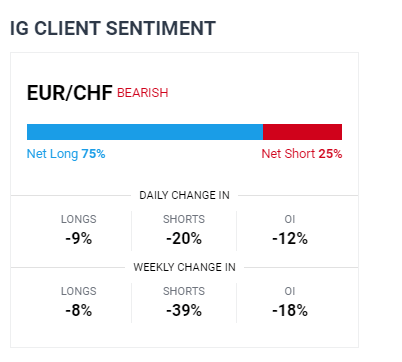
Fig 6: EUR/USD reversal with IGCS 74% long — entry, stop-loss, and take-profit marked.

Fig 7: GBP/JPY sentiment divergence — price rising while 82% of clients are short.
6. IGCS vs Other Sentiment Indicators
IGCS vs COT (Commitment of Traders) Report
The COT report shows positions of institutional traders (hedge funds, large speculators), while IGCS shows retail trader positioning. Combining both gives a complete picture of market positioning.
IGCS vs DailyFX Client Sentiment
DailyFX uses a similar methodology to IGCS, but IGCS data is updated in real-time, making it more responsive to intraday moves.
IGCS vs FXTM Sentiment
FXTM provides sentiment data from its own client base. Comparing multiple brokers helps filter out noise and identify stronger signals.
| Feature | IGCS (IG Group) | COT Report | DailyFX Sentiment |
|---|---|---|---|
| Data Source | Retail traders | Institutional traders | Retail traders |
| Update Frequency | Real-time | Weekly | Real-time |
| Forex Pairs | 30+ | 15+ | 20+ |
| Contrarian Value | High | Medium | High |
| Availability | Free | Free | Free |
7. Common Mistakes to Avoid
- ❌ Trading solely on sentiment — IGCS should never be used as your only indicator. Always combine with technical analysis.
- ❌ Ignoring technical and fundamental context — Sentiment signals are strongest when they align with key support/resistance levels and fundamental drivers.
- ❌ Poor risk management — The future always contains uncertainty. Always use stop-losses and proper position sizing.
- ❌ Trading against the trend without confirmation — Contrarian signals require price confirmation before entry — never jump in blindly.
- ❌ Trading during low liquidity — IGCS is less reliable during off-hours or holiday periods when liquidity is thin.
- ❌ Ignoring macroeconomic context — Central bank decisions and economic data can override sentiment signals. Always check the broader picture.
8. IGCS Signal Reference Table
Use this quick reference table to interpret IG Client Sentiment readings. When 60% or more of traders are positioned in one direction, it’s often a contrarian signal. The more extreme the reading (80%+), the stronger the potential reversal signal.
| Sentiment Reading | % Long | % Short | Contrarian Signal | Recommended Action | Risk Level |
|---|---|---|---|---|---|
| Extreme Bullish | 80–100% | 0–20% | 🔻 STRONG BEARISH | Consider SHORT positions | High |
| Very Bullish | 70–79% | 21–30% | 🔻 Bearish | Look for reversal patterns | Medium-High |
| Moderate Bullish | 60–69% | 31–40% | ⚠️ Cautious | Wait for confirmation | Medium |
| Neutral | 41–59% | 41–59% | ➖ Neutral | Range trading or wait | Low |
| Moderate Bearish | 31–40% | 60–69% | 🔺 Cautious | Wait for confirmation | Medium |
| Very Bearish | 21–30% | 70–79% | 🔺 Bullish | Look for reversal patterns | Medium-High |
| Extreme Bearish | 0–20% | 80–100% | 🔺 STRONG BULLISH | Consider LONG positions | High |
IGCS Delta Interpretation
| Delta Change | Interpretation | Signal Strength |
|---|---|---|
| Long % increasing rapidly | More traders buying → potential top | ⬆️ Strengthens bearish signal |
| Long % decreasing rapidly | Traders closing longs → potential bottom | ⬆️ Strengthens bullish signal |
| Long % stable | Sentiment consolidation | ⬇️ Weakens signal |
| Short % increasing rapidly | More traders selling → potential bottom | ⬆️ Strengthens bullish signal |
| Short % decreasing rapidly | Traders closing shorts → potential top | ⬆️ Strengthens bearish signal |
9. Frequently Asked Questions (FAQ)
What is IG Client Sentiment (IGCS)?
IG Client Sentiment is a proprietary indicator from IG Group showing the percentage of their clients who are net-long vs net-short on a given instrument. It’s widely used as a contrarian indicator.
Why is IGCS considered a contrarian indicator?
Retail traders often buy at tops and sell at bottoms. When 60%+ of traders are in one direction, it often signals an impending reversal. Trading against the crowd can be profitable.
How do I read the IG Client Sentiment report?
The report shows net-long and net-short percentages. A reading above 60% in one direction suggests a contrarian signal. The daily and weekly changes (delta) indicate momentum in sentiment.
What is the IGCS delta?
IGCS delta refers to the daily and weekly changes in the long percentage. A sharp increase in long positions may indicate a potential top, while a sharp decrease may indicate a potential bottom.
Can I trade using only IG Client Sentiment?
No. IGCS works best when combined with technical analysis (support/resistance, trendlines, moving averages) and fundamental context. Never rely on a single indicator.
Where can I find IG Client Sentiment data?
IGCS data is available on the official IG website (ig.com), within the IG trading platform, and on some third-party forex sentiment aggregators.
What is the best time frame for IGCS signals?
IGCS signals work on all time frames, but they are most reliable on daily and weekly charts. Higher time frames filter out market noise and provide more accurate contrarian signals.
How often does IGCS update?
IGCS data is updated in real-time throughout the trading day. The daily changes are calculated based on a 24-hour rolling period.
10. Conclusion
IG Client Sentiment is a powerful addition to any forex trader’s toolkit. By tracking retail trader positioning, you gain a real-time window into market psychology and can identify potential reversal points before they happen.
Key takeaways:
- ✅ IGCS shows the percentage of net-long vs net-short positions.
- ✅ It is a contrarian indicator — extremes (60%+) signal potential reversals.
- ✅ The IGCS delta (daily/weekly changes) provides short-term momentum signals.
- ✅ Combine IGCS with technical analysis for the most reliable signals.
- ✅ Use the IGCS Signal Reference Table above to quickly interpret sentiment data.
Want to learn more? Check out our other guides on Forex Basics and Price Action Trading.
📖 Master the basics: Before diving into sentiment trading, make sure you understand the fundamentals. Read our complete guide on what a pip is and how to use pips in forex trading — essential knowledge for every trader.
🤖 Automate your IGCS strategy: Combine sentiment analysis with automated trading. Explore our collection of best forex robots and Expert Advisors (EAs) designed to implement contrarian strategies with precision and consistency.
 Signal2forex.com - Best Forex robots and signals


