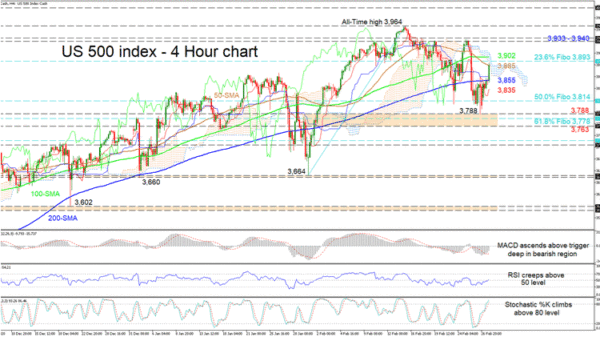
The US 500 index (Cash) is trying to conquer the region from the 50-period simple moving average (SMA) until the 100-period SMA, after a foothold at the 3,788 level repowered the positive sentiment. The flattening out of the 100- and 200-period SMAs as well as the completed bearish crossover of the falling 50-period SMA are together signalling some waning in the up drive.
Nevertheless, the Ichimoku lines are suggesting a pickup in positive momentum, while the short-term oscillators are promoting growing positive drive. The MACD, in the negative region is climbing above its red trigger line heading to zero, while the RSI is sustaining its rise above the 50 level. The stochastic oscillator is indicating further gains in price as it is rising in overbought territory.
If buying interest intensifies, initial resistance could develop from the zone starting from the 50-period SMA at 3,885 until the 100-period SMA at 3,902 – an area that surrounds the 3,893 level, which happens to be the 23.6% Fibonacci retracement of the up leg from the trough of 3,664 until the all-time high of 3,964. Surpassing this key obstructing section and the cloud, the price could then challenge the resistance band of 3,933-3,940, whilst eyeing the all-time top.
Otherwise, if sellers resurface, support could commence from the horizontal blue Kijun-sen line until the nearby 200-period SMA at 3,855. A downwards violation of the long-term average could then meet the red Tenkan-sen line at 3,835, before the index sinks to test the 50.0% Fibo of 3,814. Diving from here, the bears would then face a critical support region of 3,763-3,788, which also encapsulates the 61.8% Fibo of 3,778.
Summarizing, the US 500 index’s broader positive structure remains intact above the 3,660-3,664 border, while a shift below the buffer zone of 3,763-3,788 could escalate negative tendencies.


 Signal2forex.com - Best Forex robots and signals


