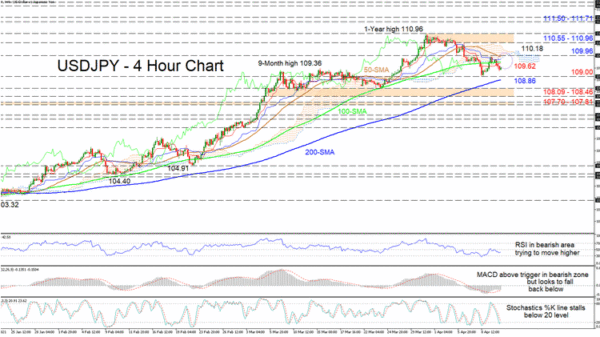
USDJPY’s recent pullback from the 1-year high of 110.96 seems may not have the necessary potency to successfully overpower the positive bias. The advancing 100- and 200-period simple moving averages (SMAs) are defending the positive structure, while the declining 50-period SMA is endorsing further price deterioration in the pair.
The Ichimoku lines are reflecting neutral impetus and the short-term oscillators are transmitting conflicting signals in directional momentum. The MACD is currently above its red trigger line in the bearish zone and is looking set to steer back below it. However, both the rising stochastic %K line and the improving RSI are suggesting positive sentiment may be picking up.
If sellers manage to retake control and steer the price down, vital support could develop in the vicinity of the 109.00 handle, as the 200-period SMA of 108.86 is approaching from beneath. If these strong barriers fail to provide an adequate foothold for buyers, selling interest may intensify and the support base of 108.09-108.46 may quickly be challenged. Successfully diving underneath this key floor, next downside limitations could arise from the region of 107.70-107.81 – pertaining to early July 2020.
To the upside, initial tough resistance could evolve from the red Tenkan-sen line at 109.62 until the 109.96 high. In the event buyers surpass these congested resistance barriers, the cloud’s upper band at 110.18 could then come into the picture, before the bulls make efforts to resume the uptrend by overstepping the resistance section of 110.55-110.96. Succeeding, they may then target the 111.50-111.71 obstacle.
Concluding, a nearing bearish crossover by the 50-period SMA could direct the pair lower, while the 109.00 mark could provide new footing to fuel a price push to revisit the 1-year high.


 Signal2forex.com - Best Forex robots and signals


