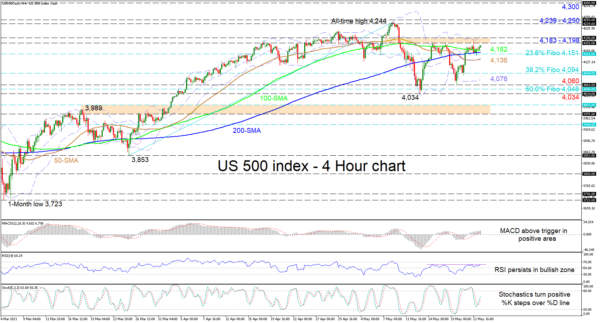
The US 500 stock index (Cash) is conveying a slight increase in positive impetus, after its latest rally off the 4,060 low lifted the price above the 4,151 barrier. The latter happens to be the 23.6% Fibonacci retracement of the up leg from 3,853 until 4,244, and the current vicinity of the advancing 200-period simple moving average (SMA). The marginal upturn in the mid-Bollinger band and the flattening out of the bearish 50-period SMA are together signalling that positive sentiment is starting to gain an advantage, which could assist the index’s freshly formed foothold around the above mentioned levels.
Furthermore, the short-term oscillators are endorsing growing positive momentum. The MACD is starting to increase above its red trigger line, which is not too far above the zero threshold, while the RSI is steering towards its previous high in the bullish territory. Moreover, the positively charged stochastic oscillator is promoting an upside price extension in the index.
Nonetheless, additional price gains could remain limited should buyers fail to conquer the nearby capping zone of 4,183-4,198. However, triumphing over this fortified resistance obstacle and the adjoining upper Bollinger band, buyers could then aim for the all-time high of 4,244, encapsulated between the 4,239 and 4,250 obstacles respectively. From here, navigating into unmapped territory, the 4,300 mark could become buyers’ next target.
If sellers resurface, they face an immediate support zone from the 100-period SMA at 4,162 until the 23.6% Fibo of 4,151. Yet, fading below this, the price could meet the 50-period SMA at 4,136, while dipping even lower, the 38.2% Fibo of 4,094 may come into focus. Should sellers shove beneath the lower Bollinger band at 4,076, the region below between the troughs of 4,060 and 4,034 could provide downside defences to impede negative tendencies from gaining pace.
Summarizing, the neutral-to-bullish demeanour in the index seems to be maturing. Yet, a price retreat below the SMAs would start to alter this outlook.


 Signal2forex.com - Best Forex robots and signals


