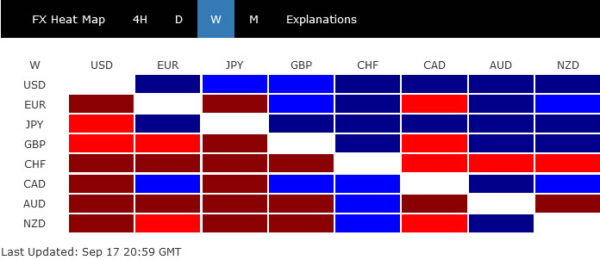
Dollar and Yen were the runaway leaders in the forex markets last week. While Fed is not quite likely to announce tapering this week, recent solid data argues that November would finally be the date. Stocks in US and Europe have been losing much upside momentum as central banks are starting to prepare for slowing down stimulus.
Besides there are concerns over re-escalating tension between China and US, with the latter’s close allies of UK and Australia added to the mix. The scale of the impact of China’s Evergrande trouble is also worrying, in the background of slowdown in the economy.
Overall, development in major indexes continue to point to increasing chance of a correction. Though, Yen was somewhat still supported additionally by the powerful Nikkei. On the other hand, Australian and New Zealand Dollars ended the the worst performing ones, together with Swiss Franc.
DOW capped by 55 day EMA, S&P 500 to test it soon
In last week’s report, we’ve noted that DOW’s break of 55 day EMA could be seen as a warnings for the US stock markets. Despite some recovery attempt DOW could stand back above the EMA. Considering bearish divergence condition in daily MACD, risk of a deeper correction continues to increase. For now, as long as 55 day EMA holds, we’d favor at least a take on 33741.16 support for the near term. Firm break there will argue that it’s already in correction to whole up trend from 26143.77. In this case, next target would be 38.2% retracement of 26143.77 to 35631.19 at 32006.99.
S&P 500 is so far still channelling well, supported multiple times by 55 day EMA too. But risk of a correction is also there considering bearish divergence condition in daily MACD. SPX might have a take on 55 day EMA this week. Sustained trading below there, followed by break of 4367.73 support, will align itself with DOW’s selloff if that happens. In that case, we’d probably see SPX heading back to 38.2% retracement of 3233.94 to 4545.85 at 4044.70 before finding a bottom.
FTSE and DAX could also be starting a deep correction
Over the Atlantic, FTSE is not looking better, as it appears to be rejected by 55 day EMA already. In the background, there is also bearish divergence condition in daily MACD. Deeper fall is in favor in the near term as long as 55 day EMA holds, for 6813.02 support. Break there will suggest that it’s at least in corrective to whole rise from 5525.52, and target 38.2% retracement of 5525.52 to 7224.46 at 6575.46.
The picture of DAX is similar. If it couldn’t bounce back above 55 day EMA soon, deeper fall would be in favor to 15048.58 support at least. Considering bearish divergence condition in daily MACD, break of 15048.58 will extend the decline as correction to the rise from 11450.08, to 38.2% retracement of 11450.08 to 16030.33 at 14280.67.
Nikkei made new 30-year high, but HSI extended down trend
Over the pacific, the picture is very mixed, however. Nikkei extended its powerful near term rally and breached prior 30-year high at 30714.52. Overbought condition could be limiting upside for now, and a pull back cannot be ruled out. But downside should be contained well above 55 day EMA to set the stage for another rally. At that time, the break of 30714.52 would likely be full of conviction.
It’s a totally different story for the Hong Kong HSI as it extended the down trend form 31183.35, after prior rejection by 55 day EMA. There is scope for a brief recovery higher, considering late Friday buying. But outlook will remain clearly bearish as long as 55 day EMA holds. Next down move could be powerful if we’re seeing a deep correction in the US. 23124.25 support will be the target.
Dollar index on track to retest 93.72 resistance, possibly further to 94.46 fib level
As for the Dollar index, we’d maintain that near term bullishness was defended together with 91.78 support. There is some upside prospect, on expectation of Fed tapering as well as risk aversion. Further rise is now in favor to retest 93.72 resistance. Break will extend the whole pattern from 89.20 to 38.2% retracement of 102.99 to 89.20 at 94.46, which is a major hurdle for the index to overcome.
Silver breached 22.36 support, ready to resume down trend
Dollar’s strength was confirmed by the steep fall in Gold, and Silver too. Indeed, Silver has already breached 22.36 support, and larger fall from 30.07 should be well positioned to resume. Next target is 61.8% projection of 28.73 to 22.36 from 24.86 at 20.92. We’d look for some initial support from there to bring rebound.
But it should also be noted that the rejection by 55 week EMA carries medium term bearish implication. The whole decline from 30.07 has the potential to drop to as low as 61.8% retracement of 11.67 to 30.07 at 18.69 before completion.
CHF/JPY in key support zone as fall from 122.74 resumed
If the markets (except Japan) do turn into a deep risk-off mode, there is prospect for further even stronger rally in crosses. Yen has the potential to continue to outperform Swiss Franc as safe haven currency. As the fall from 122.74 resumed last week, it’s now inside an important support zone between 38.2% retracement of 106.71 to 122.74 at 116.61 and 55 week EMA (now at 118.05). Sustained break there will be a strong indication of medium term bearish reversal. CHF/JPY could dive further to 61.8% retracement at 112.83 at least. But of course, the tide would turn if CHF/JPY could form a base at this zone and rebound.
After some consolidations, USD/CAD’s rebound from 1.2492 resumed by breaking through 1.2760. Initial bias is back on the upside this week for retesting 1.2947 high first. Also, larger rise from 1.2005 is still in progress with 1.2421 support intact. Break of 1.2947 will target 1.3022 fibonacci level next. On the downside, though, break of 1.2635 minor support will turn bias back to the downside for 1.2421 structural support.
In the bigger picture, fall from 1.4667 is seen as the third leg of the corrective pattern from 1.4689 (2016 high). It should have completed after hitting 1.2061 (2017 low) and 50% retracement of 0.9406 to 1.4689 at 1.2048. Sustained break of 38.2% retracement of 1.4667 to 1.2005 at 1.3022 will pave the way to 61.8% retracement at 1.3650 and above. Overall, medium term outlook remains neutral at worst with 1.2048/61 support zone intact.
In the longer term picture, we’re viewing price actions from 1.4689 as a consolidation pattern. Thus, up trend from 0.9506 (2007 low) is still expected to resume at a later stage. This will remain the favored case as long as 1.2061 support holds, which is close to 50% retracement of 0.9406 to 1.4689 at 1.2048. However, rejection by 55 month EMA, follow by firm break of 1.2061 support, will argue that USD/CAD has already started a long term down trend.
 Signal2forex.com - Best Forex robots and signals


