
📑 Table of Contents
- 1. What Is a Breakout Trade?
- 2. What Is a Pullback Trade?
- 3. Breakout vs Pullback — Key Differences
- 4. When to Use Each Strategy
- 5. How to Trade Breakouts
- 6. How to Trade Pullbacks
- 7. Breakout vs Pullback — Which Is Better?
- 8. Common Mistakes in Breakout and Pullback Trading
- 9. Frequently Asked Questions
1. What Is a Breakout Trade?
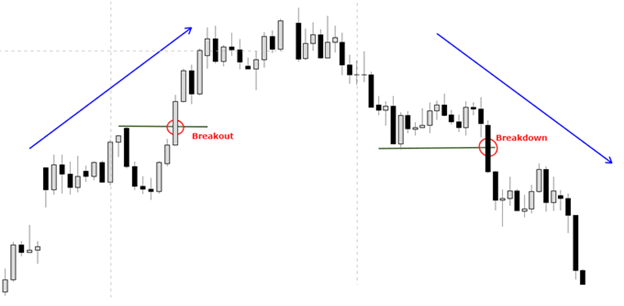
A breakout trade occurs when price moves decisively above a resistance level or below a support level, signalling a potential new trend or trend acceleration. Breakouts are driven by strong momentum, often triggered by news events, economic data releases, or a shift in market sentiment. The key characteristic of a breakout is that price “breaks out” of a defined range or pattern, creating a clear entry signal for traders.
There are three main types of breakout trades:
- Trend Breakout: Price breaks above a swing high (in an uptrend) or below a swing low (in a downtrend), confirming the continuation of the prevailing trend.
- Range Breakout: Price breaks above resistance or below support after a period of consolidation or sideways movement.
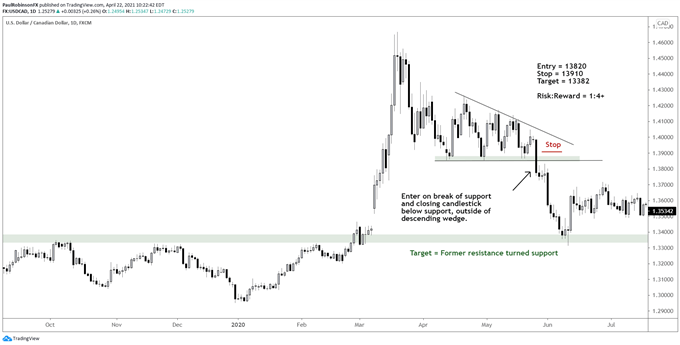
- Pattern Breakout: Price breaks out of a chart pattern such as a wedge, triangle, rectangle, flag, or head-and-shoulders formation.
Breakouts offer the potential for rapid, large moves, making them attractive to momentum traders. However, they also carry the risk of false breakouts, where price briefly breaks a level but quickly reverses. Successful breakout trading requires careful level identification, confirmation, and disciplined risk management.

2. What Is a Pullback Trade?
A pullback trade involves entering a trade during a temporary retracement against the prevailing trend. After a strong move in one direction, price often pulls back to retest a support or resistance level before continuing in the direction of the trend. Pullbacks offer traders an opportunity to enter at a better price, with a tighter stop-loss and a potentially higher risk-reward ratio.
The most common type of pullback trade is the post-breakout pullback, which occurs after price has broken through a key level and then retraces to retest that level as support or resistance. This is often considered one of the highest quality entry opportunities, as it combines the confirmation of a breakout with the favourable pricing of a pullback.
Pullback trading is based on the principle that trends rarely move in a straight line. Instead, they move in a series of “impulse” moves followed by “corrective” moves. By entering on the corrective move (the pullback), traders can position themselves for the next impulse move in the direction of the trend.
3. Breakout vs Pullback — Key Differences
Understanding the key differences between breakout and pullback trades is essential for choosing the right strategy for your trading style and market conditions.
| Feature | Breakout Trade | Pullback Trade |
|---|---|---|
| Entry Point | Price breaks through key level | Price retraces to support/resistance |
| Market Condition | Volatile, trending, or range-bound | Trending market with corrections |
| Risk Level | Higher (false breakouts common) | Lower (confirmation available) |
| Timing | Immediate or after close | Wait for retracement to level |
| Confirmation | Closing candle beyond level | Price action at support/resistance |
| Best For | Momentum traders | Patience traders |
📌 Neither strategy is inherently better — each suits different market conditions and trading styles.
4. When to Use Each Strategy
Choosing between a breakout and a pullback strategy depends on the current market environment and your personal trading style.
When to Trade Breakouts
- Strong momentum: When news or economic data is driving significant price movement.
- Range-bound markets: When price has been consolidating and is ready to break out of the range.
- High volatility: When the average true range (ATR) is expanding, indicating increased volatility.
- Chart pattern completion: When a triangle, wedge, or rectangle pattern is nearing its apex.
When to Trade Pullbacks
- Strong trend: When the market is clearly trending and showing higher highs and higher lows (or vice versa).
- Post-breakout: When price has broken a key level and is retracing to test it as support or resistance.
- Low volatility: When the market is calm and price is likely to respect support and resistance levels.
- Confluence: When multiple technical factors align at the pullback level (e.g., Fibonacci, moving average, trendline).
5. How to Trade Breakouts
Trading breakouts requires a systematic approach to identify valid setups, enter at the right time, and manage risk effectively.
Entry Techniques
| Method | Description | Pros | Cons |
|---|---|---|---|
| Immediate Entry | Enter as soon as level is crossed | Captures full move | Higher risk of false breakout |
| Closing Candle | Wait for candle close beyond level | More confirmation | May miss part of move |
| Combination (50/50) | Enter 50% immediately, 50% on close | Balanced approach | Requires more capital |
📌 The combination approach is often recommended for balancing risk and reward.
Stop-Loss Placement
Place your stop-loss just beyond the breakout level. For a long trade (buying a breakout above resistance), place the stop-loss below the resistance level. For a short trade (selling a breakout below support), place the stop-loss above the support level. This protects against false breakouts while allowing the trade room to breathe.
Take-Profit Targets
Target the next significant support or resistance level. A common approach is to use a risk-reward ratio of 1:2 or better, meaning your profit target should be at least twice the distance of your stop-loss.
Identifying False Breakouts
False breakouts occur when price briefly breaks a level but quickly reverses. To avoid them:
- Wait for a closing candle beyond the level
- Look for increased volume on the breakout
- Avoid trading breakouts during low volatility periods
- Check for confluence with other technical factors
6. How to Trade Pullbacks
Pullback trading is about patience and precision. The goal is to enter at the best possible price during a retracement, with a clear stop-loss and a favourable risk-reward ratio.
Entry Techniques
- Support/Resistance Retest: Wait for price to retrace to a key support (in an uptrend) or resistance (in a downtrend) level.
- Price Action Confirmation: Look for reversal candles such as pin bars, engulfing patterns, or bullish/bearish divergence at the pullback level.
- Fibonacci Retracement: Use Fibonacci levels (e.g., 38.2%, 50%, 61.8%) to identify potential pullback zones.
- Moving Average Support: In a strong trend, price often pulls back to a key moving average (e.g., 50-day or 200-day) before continuing.
Stop-Loss Placement
Place your stop-loss just beyond the pullback level. For a long trade (buying a pullback in an uptrend), place the stop-loss below the support level. For a short trade (selling a pullback in a downtrend), place the stop-loss above the resistance level.
Take-Profit Targets
Target the previous swing high (for longs) or swing low (for shorts). A risk-reward ratio of 1:2 or better is recommended.
Post-Breakout Pullback Strategy
The post-breakout pullback is one of the highest quality entry opportunities. After a breakout, wait for price to retrace to the breakout level (which now acts as support or resistance) and look for price action confirmation before entering.
7. Breakout vs Pullback — Which Is Better?
Neither strategy is inherently better — each has its strengths and weaknesses. The best approach depends on your trading style, risk tolerance, and market conditions.
| Condition | Recommended Strategy | Why |
|---|---|---|
| Strong momentum, news-driven | Breakout | Momentum likely to continue |
| Consolidation after trend | Pullback | Trend likely to resume |
| Range-bound market | Breakout (range breakout) | Range breakouts are clearer |
| Post-breakout pullback | Pullback | Highest quality entry |
| Low volatility environment | Avoid both | Low probability setups |
📌 Many successful traders combine both strategies, using breakouts for initial entries and pullbacks for add-on positions.
8. Common Mistakes in Breakout and Pullback Trading
Even experienced traders make mistakes when trading breakouts and pullbacks. Here are the most common pitfalls and how to avoid them.
- Chasing Breakouts: Entering a trade after a large move without waiting for a pullback can result in buying at the top or selling at the bottom.
- Ignoring Higher Timeframes: Trading breakouts or pullbacks without considering the daily and weekly trends can lead to trading against the broader market direction.
- Placing Stops Too Tight: Placing stop-losses too close to entry levels increases the risk of being stopped out by normal market noise.
- Trading Without Confirmation: Entering a breakout without waiting for a closing candle, or a pullback without price action confirmation, increases the risk of false signals.
- Overtrading: Taking too many trades, especially during volatile periods, can lead to emotional decision-making and losses.
- Ignoring Risk-Reward: Entering trades with a risk-reward ratio of less than 1:2 can make it difficult to be profitable over the long term.
- Failing to Identify False Breakouts: Not recognising false breakouts can lead to significant losses. Always look for volume confirmation and closing candles beyond the level.
9. Frequently Asked Questions
What is the difference between a breakout and a pullback?
A breakout occurs when price moves decisively above resistance or below support, signalling a potential new trend. A pullback is a temporary retracement against the prevailing trend, offering an entry opportunity at a better price before the trend resumes.
Which is better — breakout or pullback trading?
Neither is inherently better — each suits different market conditions. Breakouts work well in volatile, trending markets, while pullbacks are ideal in trending markets with corrections. The best strategy depends on your trading style and market context.
What is a post-breakout pullback?
A post-breakout pullback is the first retracement following a breakout. It often represents one of the highest quality entry opportunities, as it appears early in what may become an extended trend.
How do you trade a breakout?
To trade a breakout, identify a key resistance or support level. Enter when price breaks through with momentum, either immediately or after a closing candle confirms the break. Place your stop-loss just beyond the breakout level and target the next support/resistance level.
How do you trade a pullback?
To trade a pullback, identify a trending market and key support/resistance levels. Wait for price to retrace to these levels and look for price action confirmation (reversal candles). Enter with a stop-loss beyond the level and target the previous high/low.
What are false breakouts and how do you avoid them?
False breakouts occur when price briefly breaks a level but quickly reverses. To avoid them, wait for a closing candle beyond the level, look for increased volume on the breakout, and avoid trading breakouts during low volatility periods.
What is the best risk-reward ratio for breakout and pullback trades?
A risk-reward ratio of 1:2 or better is recommended for both breakout and pullback trades. This means your potential profit should be at least twice your potential loss.
Which currency pairs are best for breakout and pullback trading?
Major pairs like EUR/USD, GBP/USD, and USD/JPY work well for both strategies due to their high liquidity and volatility. These pairs offer clear levels and reliable price action.
Can you combine breakout and pullback strategies?
Yes, many traders combine both strategies. For example, you can enter a breakout trade and then add to your position on a pullback if the trend continues. This approach can maximise profits while managing risk.
What is the success rate of breakout vs pullback trading?
Breakout trades typically have a success rate of 50-60%, while pullback trades can achieve 60-70% with proper confirmation. However, success rates vary based on market conditions and the trader’s skill in identifying valid setups.
📊 Master Advanced Technical Analysis: Take your breakout and pullback trading to the next level with our comprehensive guide to Andrews pitchfork trading and median line analysis — a powerful trend-following tool that helps identify market channels, support and resistance levels, and potential reversal points. Learn how the 80% median line principle can complement your breakout and pullback strategies for higher-probability entries.
📈 Enhance Your Breakout and Pullback Entries: Improve your trade timing with the CHAMPION Forex Holy Grail indicator — a highly accurate arrow indicator that displays signals without delay or redrawing, based on volume spread analysis (VSA). Perfect for confirming breakout and pullback entries on any timeframe and currency pair.



 Signal2forex.com - Best Forex robots and signals


