An Introduction to Breakout Trading
In our last section we looked into range-bound market conditions and mean-reversion strategies. As we shared, markets will either be trending or they won’t, and that pretty much denominates most of a market’s state.
But, we now have trends and we have ranges: And the transitory state between a range and a trend, when prices move out of the pattern of mean-reversion, is a breakout, which is often considered to be the third ‘market condition’ that traders can focus on.
Breakouts are incredibly exciting given the fast momentum. It’s the basis of trading, if you think about it, because what allows for new price movements is often new information, which will then compel buyers and sellers to price that information in. That can lead to fast and aggressive moves as new highs or lows print with buyers and sellers incorporating this new, fresh information.
Recommended by James Stanley
The Fundamentals of Breakout Trading
There’s but one problem with this scenario: Breakouts are unpredictable. So, for the trader that sees a range or a mean-reverting market to then approach that backdrop with breakout logic – they are, by default, expecting something new to happen that would change the paradigm that the trader’s analysis was built off of. So, generally speaking, breakouts are often approached as lower probability events.
But – this isn’t necessarily an entirely negative thing. When a breakout does take hold, the movement can be significant, which is one of the main allures of the market condition. So, if the trader can effectively manage the losses on the majority of trades that likely won’t continue to run after testing the breakout, there’s still the possibility of a profitable model even if the trader’s strategy is only seeing a success rate of 25 or 30%.
What is a Breakout
To put it simply, a breakout is a move to a fresh higher or low after a period of consolidation. Big picture, breakouts can exist on one minute charts the same as they can on daily or weekly charts. But, due to the ever-present noise of shorter time frames, traders are often focusing such approaches on chart time frames of an hour or longer for intra-day approaches or a day or longer for long-term approaches.
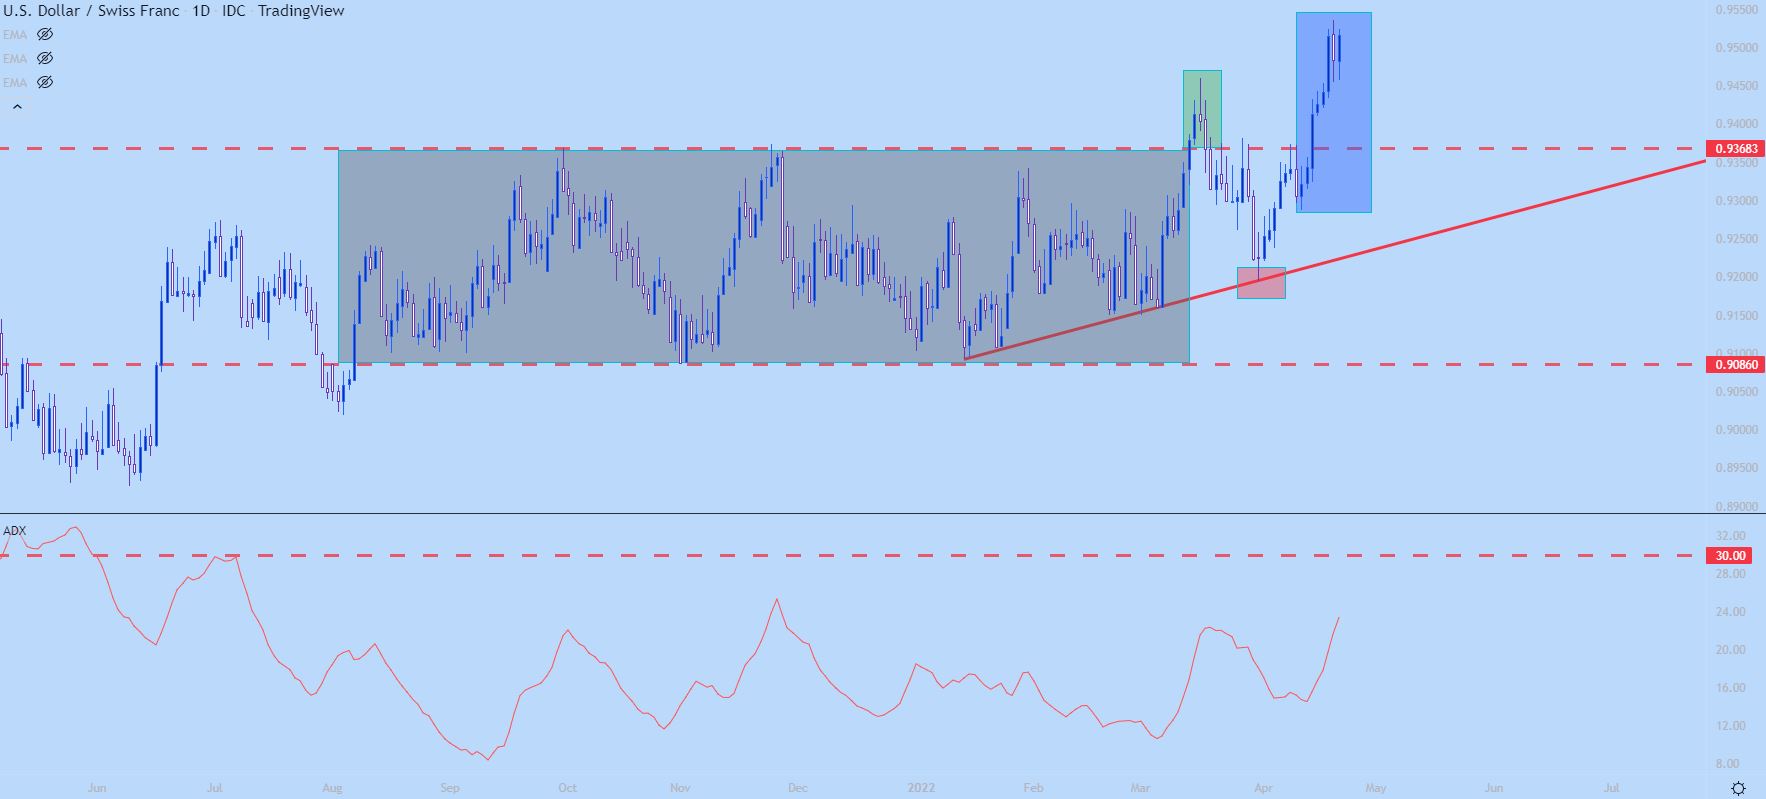
On the below daily chart of USD/CHF we’re looking at a range-bound formation in grey as both support and resistance held price action for an extended duration. This highlights equilibrium as both buyers and sellers are keeping prices fairly balanced here.
The initial breakout shows in green and that was the first breach of the formation which could be approached for breakout strategies.
Recommended by James Stanley
Lessons From Top Women Traders
Prices then pulled back into the prior range, finding support on the bullish trendline that was in-play before the break. This opened the door for trending strategies on the basis of the trendline hold (in red), after which buyers then posted another topside push with a fresh high following shortly after (in blue).
USD/CHF Daily Price Chart
Chart prepared by James Stanley, USD/CHF Daily, July 2021 – April 2022
How to Find Breakouts
Like both ranges and trends traders can choose to look for breakouts using either indicators or price action, with the latter approach being considerably more subjective. As such, many new traders will look to avoid that subjectivity by using an objective framework provided by the indicator.
One technical indicator that could be helpful in locating potential breakouts is the Average Directional Index, which gauges trend strength. Because the trader would be looking for a ‘new’ trend or theme, they would want to adopt a similar focus of range traders, looking for environments in which ADX was below a cut-off level such as 30, as we had looked at in our primer on the Average Directional Index (ADX) indicator.
Introduction to Technical Analysis
Learn Technical Analysis
Recommended by James Stanley
On the below chart of USD/CHF, I’ve added the ADX indicator and notice how it remained below 30 for the entire duration of the range and the ensuing breakout.
USD/CHF Daily Price Chart
Chart prepared by James Stanley, USD/CHF Daily, July 2021 – April 2022
Breakouts Around News Events
One note of caution and a trap that many new traders will fall into is looking for breakouts around major news events. This is particularly relevant for Forex and futures markets, as equity markets will often attempt to release major drivers like earnings reports outside of market hours. But in the case of Forex pairs or for futures markets -announcements from Central Banks or data releases for inflation or employment numbers can create considerable intra-session volatility.
Read More on How to Trade Earnings Season
While these drivers can often compel breakouts, they can also be extremely messy with a lot of whipsaw, with resistance breaching temporarily before prices reverse after the data gets priced-in to the market. Trading around news events can be especially dangerous for new traders because liquidity is often lower (market makers are often risk averse around such scenarios) and that can lead to sharper moves in either direction.
The economic calendar can be very helpful for staying up to date on which news releases are expected and when, along with how impactful that release is usually expected to be.
— Written by James Stanley, Senior Strategist for DailyFX.com
Contact and follow James on Twitter: @JStanleyFX


 Signal2forex.com - Best Forex robots and signals


