There’s a litany of candlestick formations that traders can look for but few carry the potential of the engulfing candlestick.
Introduction to Technical Analysis
Candlestick Patterns
Recommended by James Stanley
Engulfing candlesticks are fairly simple to explain, it’s simply a candle that takes out the entirety of the prior candle. But, working with them can be a bit more difficult and new traders are seemingly perplexed by the formation so, we’ll dig into this topic in a little more depth in this article. We do have some additional materials available on the topic in DailyFX Education. We looked at bearish engulfing candlesticks and bullish engulfing in different articles and, in this piece, we’ll incorporate that formation into our broader price action education as these can be very actionable when they do show up.
The important takeaway is that the engulfing candlestick body must take out the entirety of the prior candlestick body – indicating a momentum-driven reversal.
Defining the Engulf
There are two types of engulfing patterns. The first and most common is an engulfing of the entire prior body. In FX or futures markets, where prices are streaming 24 hours a day, these are far more common as the end of one bar simply starts the next. This means that the prior candle’s close is this candle’s open, so if we’re going to see an engulfing formation take place, buyers will need to step in (in terms of a bullish engulf) to completely eclipse the move from the prior bar – and this bar still needs to close above the prior bar’s open.
Recommended by James Stanley
Futures for Beginners
The second brand of engulf is more rare but this would include a full engulf of the prior candle’s wicks. This would illustrate a wider range from the prior bar but, similarly, both show a possible shift in momentum.
Is one better than the other? That’s difficult to say as they both illustrate the same kind of thing but, the second engulf with full cover of the prior candle’s wicks does make a strong statement about an increasing rate of activity.
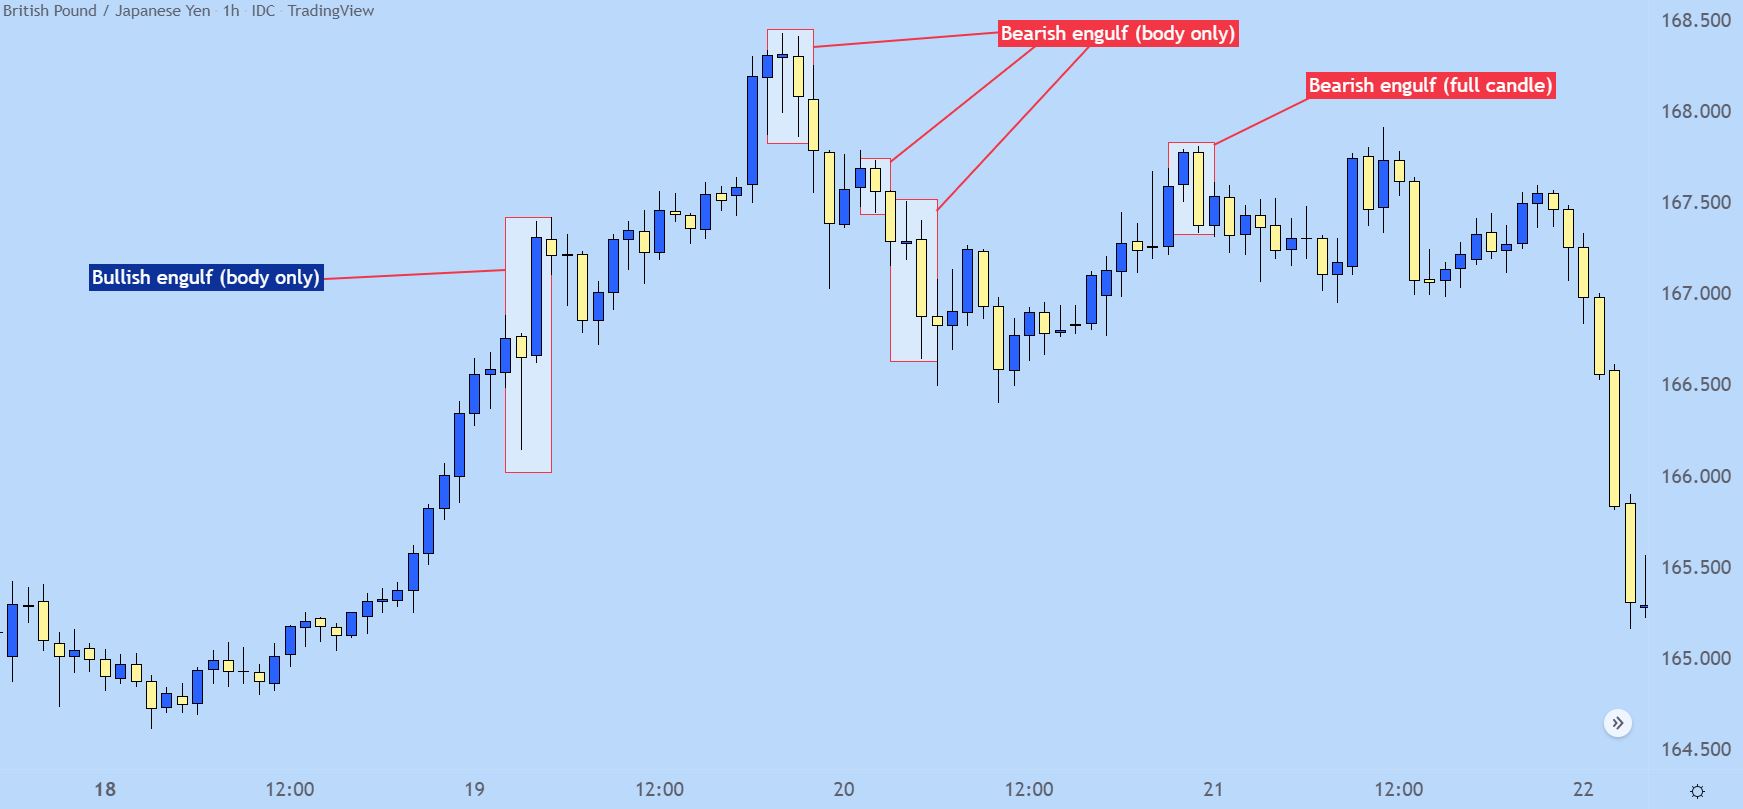
On the below hourly chart of GBP/JPY I’ve pointed out a handful of these patterns that appeared between April 17th and April 22nd, 2022. The engulf located on the far right of the chart is the only that was a full candle engulf, where even the wicks of the engulfing candlestick took out the prior bar’s entire range.
GBP/JPY Hourly Price Chart
Chart prepared by James Stanley ;GBP/JPY hourly chart, April 18 – April 22, 2022
Types of Engulfing Candlesticks
The engulfing candlestick says quite a bit and will often be approached with anticipation of something continuing to happen. There’s a few specific situations where this can come up as important, and I’ll look at a few of those below.
The Engulfing Reversal
Reversals are notoriously tough because, as traders, we’re basically saying ‘what’s been happening – is about to change.’ And by and large it’s often more advisable to follow the status quo, but when an engulfing candlestick shows up at the top of a trend that can be a big statement. And, it could also be a sign of what’s to come.
Recommended by James Stanley
The Fundamentals of Trend Trading
On the below GBP/JPY chart, I’m looking at a trend on the daily chart from Q4 of 2021. I’ve noted a few engulfs on the left side of the chart but the ‘reversal’ setup can be found towards the top of the below illustration, in red. At the time, the trend had jumped by more than 900 pips in the first three weeks of October, and then this bar showed up on the daily chart.
It wasn’t a full candle reversal, as only the body of this candle engulfed the prior candle’s body. This was a clear sign in shifting momentum that eventually played through for a really strong reversal. And, notably, the three engulfs that I pointed out before that reversal formation showed up – those also so continuation on the day after they had printed, further illustrating the potential for momentum to continue after one of these engulfing patterns print.
GBP/JPY Daily Price Chart (Sept -Dec 2021)
Chart prepared by James Stanley; GBP/JPY daily chart, Sep. – Dec. 2021
The ‘In Trend’ Engulf
Timing trends can be tricky. There’s been an observable bias so there’s a directional pull that you’d like to incorporate but, it seems that many have the same idea at the same time and this can keep trends from pulling back far enough to afford an attractive entry point. And – when the pullback does come about – how is the trader to know that it’s a pullback and not a reversal? What’s the proper way of timing re-entry in the trend-side direction?
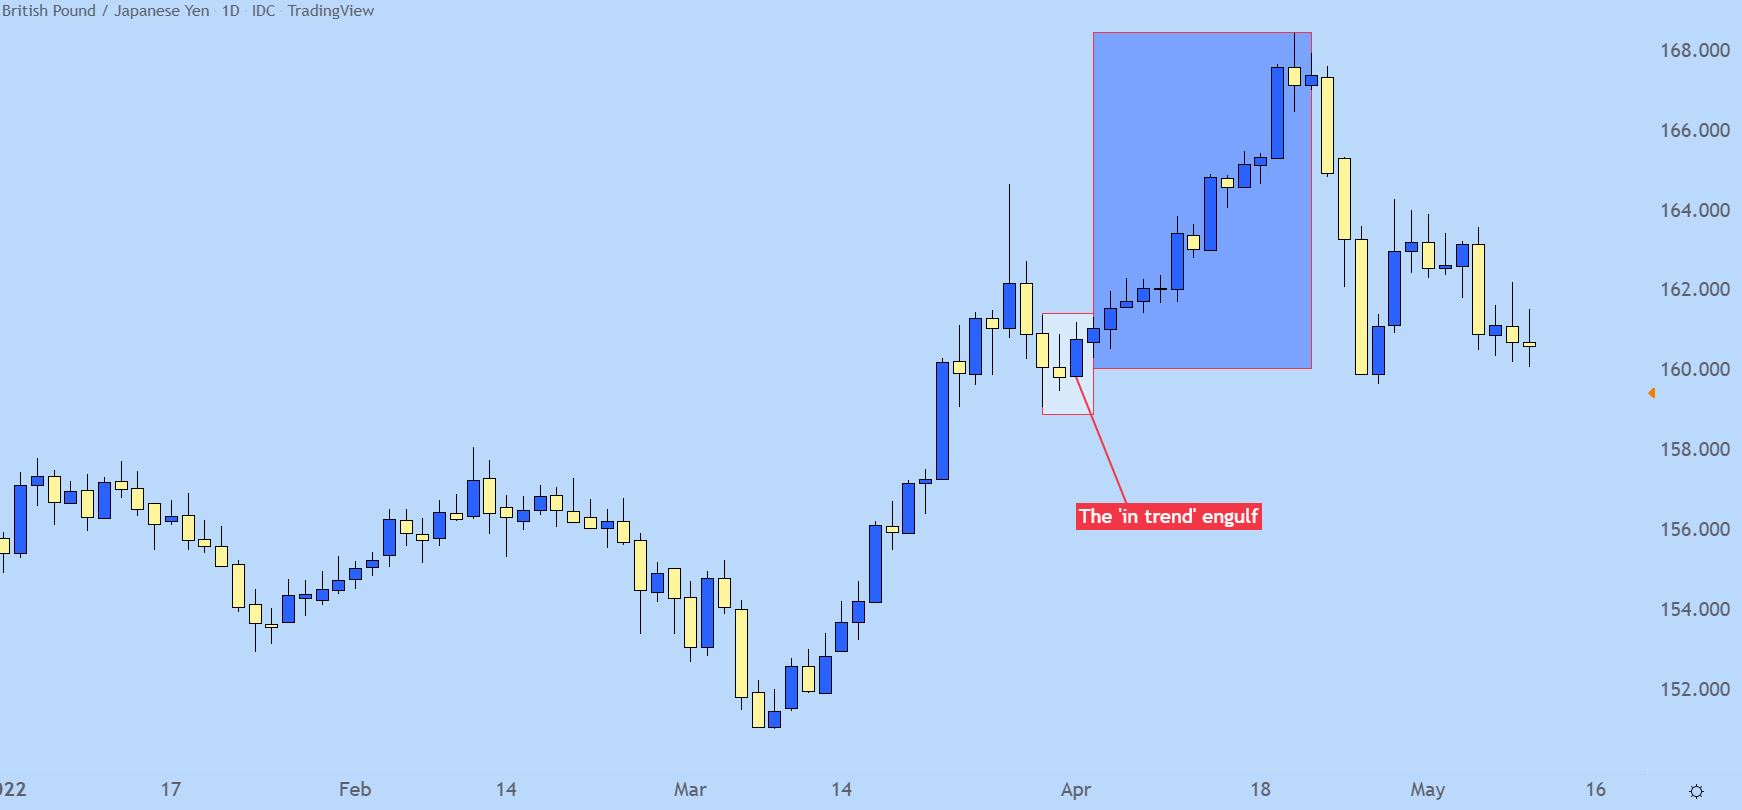
The ‘in trend’ engulfing candlestick can help with this. It’s basically looking for a pullback, followed by an engulf in the direction of the trend, thereby giving the idea that buyers are back and the trend may be ready to continue up to fresh highs.
Recommended by James Stanley
Top Trading Lessons
GBP/JPY Daily Price Chart (2022 – May 2022)
Chart prepared by James Stanley; GBP/JPY daily chart, Jan – May 2022
The Counter Trend Engulf
On that topic of trends – for traders looking to fade the move, engulfs can help there, as well. The essential logic would be waiting for an engulf to print in the opposing direction of the trend, which may turn into a bigger picture reversal.
Sure, not everyone will turn into a full-fledged reversal. But – it can help to open the door for reversal strategies and the momentum that can carry through such a formation will usually allow for some fast counter-trend movement.
GBP/JPY Daily Price Chart
Chart prepared by James Stanley; GBP/JPY daily chart, Jan – May 2022


 Signal2forex.com - Best Forex robots and signals


