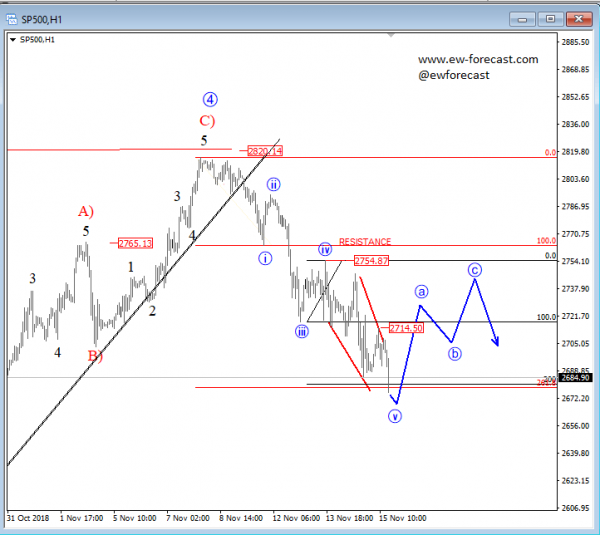
S&P500 like Nasdaq found a new low, with an ending diagonal within wave v. We can now see price trading at possible Fibonacci support around 200.0 and 261.8, from where a new bounce and a temporary reversal in three-waves may follow. That said, a rally in impulsive fashion and above the 2714 level will confirm a correction to be in play.
NASDAQ also found a new low. After that five-wave decline in the US stock market, wave »v« looks like an ending diagonal, so watch out for a bounce into a three-wave a-b-c correction back to 6950 resistance area, from where we may see another sell-off!


 Signal2forex.com - Best Forex robots and signals


