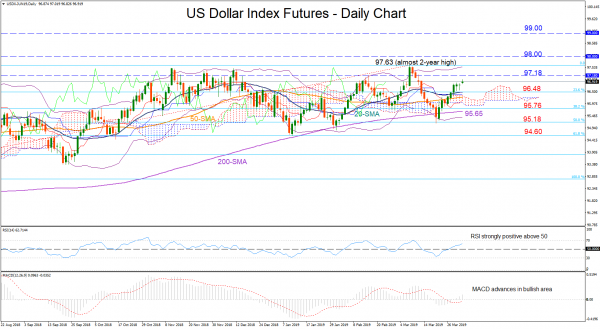
Following the close under the 200-day moving average (MA), the US dollar index future price (with an expiry date in June) regained considerable ground to overcome its MAs once again and return above the Ichimoku cloud, staying mostly green over the past two weeks.
Technically, more upsides could be in store as the MACD keeps strengthening in the positive zone and above its red signal line, while the RSI is maintaining a steep positive slope well above its 50-neutral mark. The fact that the price has still some room to run until it touches the upper Bollinger band could be also a sign that downside corrections may be less likely in the short term.
An extension higher and above the 97 level could meet nearby resistance from the February 15 peak of 97.18, while a more decent rally could push the price until the almost two-year high of 97.63 reached early in March, where the upper Bollinger band is also positioned now. Clearing this top, the next important point to watch out for is 99 but before that, the 98 level could appear psychologically restrictive.
On the flip side, a decline under 96.48, the 23.6% Fibonacci of the upleg from 92.74 to 97.63, could pressure the market towards the 38.2% Fibonacci of 95.76. Slightly lower at 95.65, the 200-day MA may become the trigger point for a new sell-off, with the 50% Fibonacci of 95.18 closely watched in such a case.
In the bigger picture, the market remains in neutrality as long as it holds strictly between 97.63 and 94.60.
Signal2forex reviews
 Signal2forex.com - Best Forex robots and signals


