

📑 Table of Contents
- 1. What Is a Trendline in Forex Trading?
- 2. How to Draw Trendlines Correctly — Step-by-Step Guide
- 3. Types of Trendlines — Uptrend, Downtrend, and Channels
- 4. How to Trade Trendlines — Bounce vs Breakout
- 5. How to Identify False Breakouts
- 6. Trendline Trading Strategies
- 7. Trendlines vs Support and Resistance
- 8. Common Trendline Mistakes to Avoid
- 9. Trendline Reference Table
- 10. Frequently Asked Questions
1. What Is a Trendline in Forex Trading?
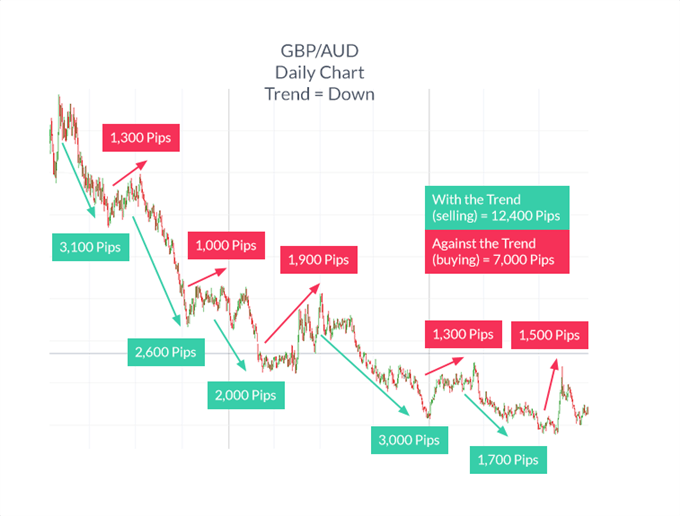
A trendline in forex is a straight line drawn on a price chart that connects two or more significant swing highs (downtrend) or swing lows (uptrend). It is one of the most fundamental tools in technical analysis, helping traders identify the direction of the trend, potential support and resistance levels, and possible entry and exit points for trades.
Trendlines are one of the oldest and most widely used tools in technical analysis, valued for their simplicity and effectiveness. They work because they represent the path of least resistance in the market. When price respects a trendline, it confirms the prevailing trend. When price breaks through a trendline, it signals that the trend may be changing or accelerating.
Trendline analysis is applicable across all timeframes and all markets — forex, stocks, commodities, and cryptocurrencies. Whether you are a day trader, swing trader, or position trader, trendlines can help you make more informed trading decisions.
2. How to Draw Trendlines Correctly — Step-by-Step Guide
Drawing trendlines correctly is the foundation of effective trendline analysis. A poorly drawn trendline can lead to false signals and costly trading mistakes.
The Rule of Three — Validation Rules
The three-touch rule is the gold standard for trendline validity. Two points are speculative; three points confirm the validity of the slope.
- First touch: Establishes the initial slope between two swing points
- Second touch: Confirms the slope is accurate
- Third touch: Validates the trendline as a significant support or resistance level
A trendline with three or more touches is considered highly reliable and respected by market participants.
Drawing an Uptrend Line (Support)
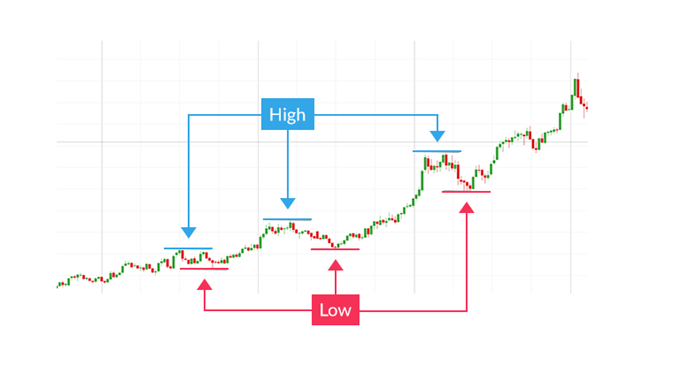
To draw an uptrend line, identify at least two higher swing lows. Connect these swing lows with a straight line, extending it to the right. The line should ideally touch the lows of at least three separate pullbacks to be considered valid. This uptrend line acts as dynamic support — price is expected to bounce off it and continue higher.
Drawing a Downtrend Line (Resistance)
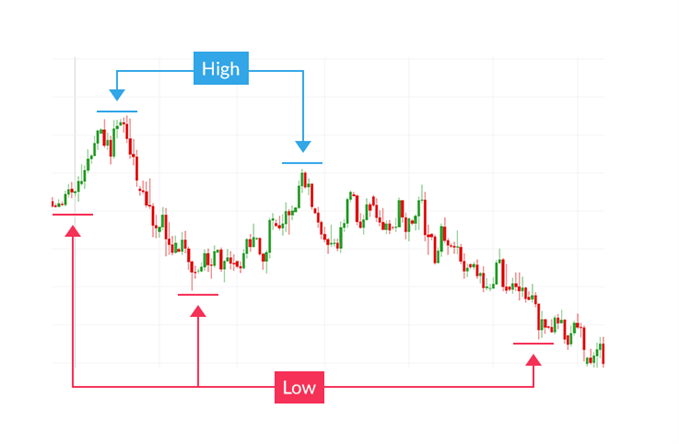
To draw a downtrend line, identify at least two lower swing highs. Connect these swing highs with a straight line, extending it to the right. The line should touch the highs of at least three separate rallies. This downtrend line acts as dynamic resistance — price is expected to be rejected and continue lower.
Common Mistakes When Drawing Trendlines
- Using the wrong swing points: Always use significant swing highs and lows, not minor wicks
- Forcing the line: Don’t force a trendline to fit your bias; let the price guide the line
- Ignoring higher timeframes: A trendline on a 1-minute chart is far less significant than one on a daily chart
- Drawing too many lines: Overcrowding your chart with trendlines creates confusion
3. Types of Trendlines — Uptrend, Downtrend, and Channels
Trendlines come in three main varieties, each corresponding to a different market condition. Recognising the type of trendline in play is essential for selecting the right trading strategy.
| Type | Slope | Market Condition | Trading Implication |
|---|---|---|---|
| Uptrend Line | Upward (positive) | Uptrend / Bullish | Buy on pullbacks to trendline support |
| Downtrend Line | Downward (negative) | Downtrend / Bearish | Sell on rallies to trendline resistance |
| Horizontal Channel | Flat (zero) | Sideways / Range | Buy at support, sell at resistance |
| Ascending Channel | Rising parallel lines | Bullish channel | Buy at support, sell at resistance |
| Descending Channel | Falling parallel lines | Bearish channel | Sell at resistance, buy at support |
📌 Each type of trendline reflects a different market psychology. Ascending lines show buyers in control, descending lines show sellers in control, and horizontal lines show equilibrium.
4. How to Trade Trendlines — Bounce vs Breakout
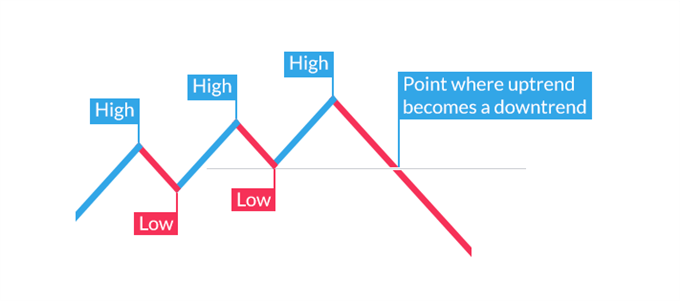
There are two primary ways to trade trendlines: the bounce (trend continuation) and the breakout (trend reversal or acceleration).
Trading the Bounce (Trend Continuation)
This is the most common trendline strategy. In a trending market, price often pulls back to the trendline before continuing in the direction of the trend.
- Entry: Enter when price touches the trendline and shows a reversal signal (bullish/bearish candlestick pattern, RSI divergence)
- Stop Loss: Place your stop-loss just beyond the trendline
- Take Profit: Previous swing high/low or measured move
- Confirmation: Wait for a bullish/bearish candlestick pattern or RSI signal before entering
Trading the Breakout (Trend Reversal)
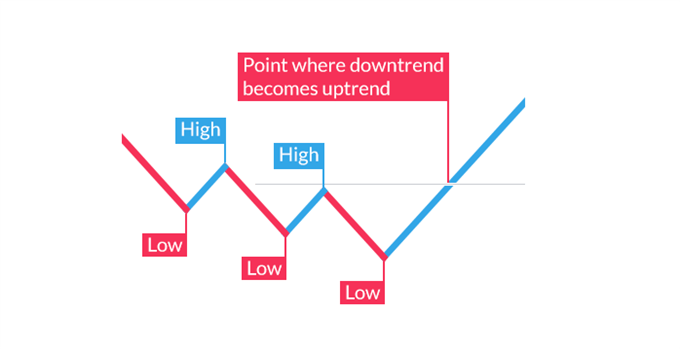
A trendline breakout occurs when price breaks through the trendline, signalling a potential trend reversal or acceleration.
- Entry: Enter when price closes beyond the trendline with increased volume
- Stop Loss: Place your stop-loss just beyond the breakout point (opposite side)
- Take Profit: Measured move (project the channel width) or next support/resistance level
- Confirmation: Wait for a confirmed close beyond the trendline with increased volume
Confirmation Techniques — RSI, MACD, Volume
- RSI Divergence: If RSI diverges from price at the trendline touch, the bounce is more likely
- MACD: A bullish/bearish crossover at the trendline adds confirmation
- Volume: A breakout with high volume is more likely to be genuine
- Candlestick Patterns: Pin bars, engulfing patterns, and inside bars at trendline touches provide strong confirmation
5. How to Identify False Breakouts
A false breakout occurs when price briefly breaks through a trendline but quickly reverses back. This is one of the most common pitfalls in trendline trading and can lead to significant losses if not identified correctly.
What Is a False Breakout?
A false breakout happens when price moves beyond a trendline (or support/resistance level) but fails to sustain the move, reversing back within the trendline. This is often referred to as a “liquidity hunt” or “stop hunt” — market makers and institutional traders deliberately push price beyond key levels to trigger retail stop-losses before reversing the trend.
How to Spot False Breakouts
- Low Volume: A breakout with below-average volume is likely false
- Quick Reversal: If price breaks out and reverses within the same candle or the next candle, it’s likely false
- Lack of Follow-Through: If price fails to continue in the breakout direction, it’s likely false
- Rejection Candles: A long upper wick (for upside breakout) or lower wick (for downside breakout) suggests rejection
- Closing Inside: If price closes back inside the trendline after the breakout, the breakout is invalidated
Trading False Breakouts
Some traders specialise in trading false breakouts. The strategy involves:
- Entry: Enter in the opposite direction when price reverses after a false breakout
- Stop Loss: Place stop-loss just beyond the false breakout extreme
- Take Profit: The opposite side of the trendline or the measured move
- Confirmation: Wait for price to close back inside the trendline with a reversal candlestick pattern
6. Trendline Trading Strategies
There are several effective ways to trade with trendlines. The key is to match the strategy to the current market conditions.
Strategy 1 — Trendline Bounce with RSI Confirmation
- Setup: Identify a valid trendline with at least 3 touches
- Entry: Price touches trendline and RSI shows divergence or overbought/oversold condition
- Stop Loss: Just beyond the trendline
- Take Profit: Previous swing high/low or 2:1 risk-reward ratio
- Best for: Trending markets with clear direction
Strategy 2 — Breakout with Volume Confirmation
- Setup: Identify a trendline that has been respected multiple times
- Entry: Price closes beyond the trendline with above-average volume
- Stop Loss: Just beyond the breakout point
- Take Profit: Measured move or next major support/resistance level
- Best for: Range breakouts and trend acceleration
Strategy 3 — Trendline Channel Trading
- Setup: Identify a channel with parallel support and resistance lines
- Entry: Buy at channel support, sell at channel resistance
- Stop Loss: Just beyond the channel line
- Take Profit: Opposite channel line
- Best for: Sideways markets and range-bound conditions

7. Trendlines vs Support and Resistance
Trendlines and support/resistance levels are both essential tools in technical analysis, but they serve different purposes and have distinct characteristics.
| Aspect | Trendlines | Support & Resistance |
|---|---|---|
| Shape | Diagonal | Horizontal |
| Shows | Trend direction and slope | Key price levels |
| Dynamic vs Static | Dynamic (moves with price) | Static (fixed price levels) |
| Purpose | Identify trend, entry/exit points | Identify reversal and breakout zones |
| Validation | Rule of Three (3+ touches) | Multiple touches and tests |
| Best Use | Trending markets | Ranging and trending markets |
📌 Many traders combine both tools — using trendlines to identify the trend direction and support/resistance levels for precise entry and exit points.
8. Common Trendline Mistakes to Avoid
Avoiding these common mistakes will help you use trendlines more effectively and avoid costly trading errors.
- Forcing a Trendline: Trying to fit a line where no clear trend exists is a recipe for losses. Wait for clearer price structure with at least two significant swing points.
- Ignoring Wicks: Using only closing prices and ignoring wicks can lead to inaccurate trendlines. Use candle wicks for more precise lines.
- Using the Wrong Timeframe: A trendline on M5 is far less reliable than one on H4 or Daily. Match your timeframe to your trading style.
- Too Steep: A trendline with an angle greater than 45° is often unreliable. Extremely steep trendlines are prone to false breaks.
- No Confirmation: Entering on the first touch without confirmation is a common mistake. Wait for at least the second or third touch before considering a trade.
- Ignoring Volume: A breakout without volume confirmation is likely a false breakout. Always check volume on breakouts.
- Overcrowding the Chart: Drawing too many trendlines creates confusion. Keep your chart clean and focused on the most significant lines.
9. Trendline Reference Table
This reference table provides a quick summary of the key concepts related to trendline trading.
| Concept | Description |
|---|---|
| Trendline | A straight line connecting significant swing highs or swing lows |
| Uptrend Line | Connects higher swing lows (acts as support) |
| Downtrend Line | Connects lower swing highs (acts as resistance) |
| Channel | Two parallel trendlines (support and resistance) |
| Rule of Three | Three touches confirm a valid trendline |
| Bounce | Price touches trendline and reverses (trend continuation) |
| Breakout | Price breaks through trendline (trend reversal or acceleration) |
| False Breakout | Price breaks through but quickly reverses back |
| Confirmation Tools | RSI, MACD, Volume, Candlestick patterns |
📌 Manual trendlines offer a 42-55% win rate, but combining them with confirmation tools significantly improves success rates.
10. Frequently Asked Questions
What is a trendline in forex trading?
A trendline in forex is a straight line drawn on a price chart that connects two or more significant swing highs (downtrend) or swing lows (uptrend). It helps traders identify the direction of the trend, potential support/resistance levels, and possible entry and exit points.
How do you draw a trendline in forex?
To draw a trendline, identify at least two significant swing points. For an uptrend, connect two or more higher swing lows (support). For a downtrend, connect two or more lower swing highs (resistance). The line should touch at least three points for validation (Rule of Three).
What is the Rule of Three in trendline trading?
The Rule of Three states that a trendline is valid when price touches it at least three times. Each touch confirms the trendline’s strength. The more touches, the more reliable the trendline.
How do you trade a trendline bounce?
A trendline bounce occurs when price touches the trendline and reverses in the direction of the trend. Enter a trade when price shows confirmation (bullish/bearish candlestick pattern, RSI signal) and place a stop-loss just beyond the trendline.
How do you trade a trendline breakout?
A trendline breakout occurs when price breaks through the trendline, signaling a potential trend reversal. Wait for a confirmed close beyond the trendline with increased volume before entering, and place a stop-loss just beyond the breakout point.
What is the difference between a trendline and support/resistance?
A trendline is diagonal and shows the slope of the trend, while support and resistance are typically horizontal levels. Trendlines help identify the trend direction, while support/resistance identifies key price levels where price is likely to reverse.
How do you identify a false breakout?
A false breakout occurs when price briefly breaks through a trendline but quickly reverses back. Signs include: low volume on the breakout, price closing back inside the trendline, or a bearish/bullish reversal candlestick pattern forming immediately after the break.
What are the best timeframes for trendline trading?
Higher timeframes (H4, Daily, Weekly) produce more reliable trendlines. Lower timeframes (M5, M15) can still be used but are more prone to false breakouts and require stricter confirmation rules.
What is a trendline channel?
A trendline channel consists of two parallel trendlines — one connecting swing highs (resistance) and one connecting swing lows (support). Price moves within this channel, providing clear trading ranges for buying at support and selling at resistance.
What is the success rate of trendline trading?
Manual trendlines offer a 42-55% win rate, making them a moderate-probability strategy. However, when combined with confirmation tools like RSI, MACD, volume analysis, and price action patterns, the success rate can be significantly improved.
📊 Deepen Your Trendline Knowledge: This guide covers the essentials, but if you’re ready to master the fundamentals, explore our comprehensive Trendline Analysis: Complete Trading Guide — covering trendline psychology, the three-touch confirmation rule, common drawing mistakes, and practical trading strategies in greater depth.
📈 See Trendlines in Action — EURGBP Case Study: Trendlines are not just theoretical — they play out in real market conditions every day. Read our analysis of how EURGBP remained trapped between two diagonal trendlines, demonstrating how price action respects trendline support and resistance, and how traders can use these levels to identify potential breakouts or reversals.
 Signal2forex.com - Best Forex robots and signals


