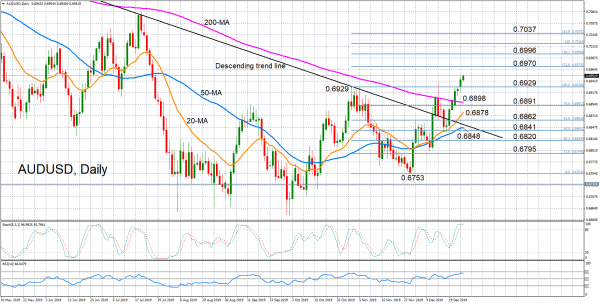
AUDUSD surged to a 5-month high of 0.6954 on Friday as the pair looked set to post a seventh straight session of gains. However, although the technical indicators suggest there’s plenty of positive momentum remaining to sustain the rally, there are some signs that the pair is in danger of becoming overbought.
The RSI continues to rise and has yet to enter the overbought region, indicating there’s scope for more gains in the near term. But the stochastics are already in overbought territory and the %K line is ready to cross below the %D line, signalling a possible downside correction, or at least, some easing in the upside momentum in the coming days.
If prices maintain their uptrend, the next hurdle may come at the 123.6% Fibonacci extension of the downleg from 0.6929 to 0.6753, at 0.6970. A successful climb above this level would open the way for the 138.2% Fibonacci just below the psychologically important 0.70 level, while higher up, the 161.8% Fibonacci of 0.7037 would be the next major target for the bulls.
However, if the AUDUSD rally loses some steam, prices may initially retreat towards the October swing high of 0.6929 before reaching for the 200-day moving average (MA), which is flatlining just below the 0.69 handle. Slipping below the 200-day MA would weaken the bullish short-term bias and bring the 20- and 50-day MAs, at 0.6878 and 0.6848 respectively, into range.
A drop below the 50-day MA would turn the short-term picture to bearish and put the focus on the 23.6% Fibonacci at 0.6795.
In the medium term, the pair seems to be shifting to a bullish outlook, having recently broken above its descending trend line and achieved a third higher high since September with the latest upswing.


 Signal2forex.com - Best Forex robots and signals


