
📑 Table of Contents
- 1. What Is Implied Volatility?
- 2. Implied Volatility vs Historical Volatility — Key Differences
- 3. How Implied Volatility Reflects Market Risk and Uncertainty
- 4. Implied Volatility Trading Ranges — Support and Resistance
- 5. How to Use Implied Volatility in Forex Trading
- 6. Implied Volatility in Commodities, Stocks, and Indices
- 7. The VIX Index — The Market’s Fear Gauge
- 8. Advantages and Limitations of Implied Volatility
- 9. Implied Volatility Reference Table
- 10. Frequently Asked Questions
1. What Is Implied Volatility?
Implied volatility (IV) is a forward-looking metric that reflects the market’s expectation of how much an asset’s price will move over a specified period. Derived from options prices using the Black-Scholes model, IV is expressed as a percentage and is often called the “market’s fear gauge.” High IV indicates expected large price swings, while low IV suggests stable prices.
Implied volatility is one of the most important concepts in modern finance. Unlike historical volatility, which looks backward at what has already happened, implied volatility looks forward — it tells you what the market expects to happen. This makes it an invaluable tool for traders seeking to understand market sentiment, identify potential inflection points, and manage risk.
For forex traders, implied volatility is particularly useful because currency markets are driven by expectations about future interest rates, economic growth, and geopolitical events. By understanding IV, traders can anticipate potential price ranges and adjust their strategies accordingly.
Simple Definition
Implied volatility is the market’s forecast of a likely movement in an asset’s price. It is derived from the price of options and represents the market’s consensus on future volatility. The higher the IV, the more the market expects prices to move. The lower the IV, the less movement is expected.
The Black-Scholes Connection
The Black-Scholes options pricing model, developed in 1973 by Fischer Black and Myron Scholes, revolutionised options trading by providing a mathematical framework for pricing options. In the model, volatility is one of the key inputs. Implied volatility is the volatility input that makes the model’s theoretical price match the market price of the option. In other words, IV is the market’s “implied” volatility based on actual option prices.
2. Implied Volatility vs Historical Volatility — Key Differences
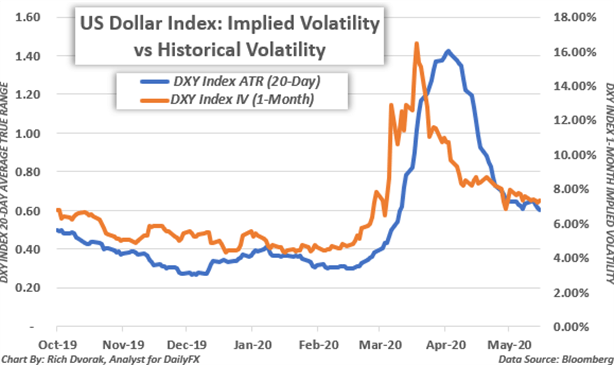
While implied volatility and historical volatility are both measures of price movement, they serve different purposes and are calculated differently. The table below summarises the key differences.
| Feature | Implied Volatility (IV) | Historical Volatility (HV) |
|---|---|---|
| Definition | Expected future price movement | Past observed price movement |
| Direction | Forward-looking | Backward-looking |
| Source | Options prices | Historical price data |
| Calculation | Black-Scholes model (derived) | Standard deviation of returns |
| Market Insight | Sentiment and expectations | Actual market activity |
| Example | VIX Index (30-day forward) | ATR (Average True Range) |
| Trading Use | Identify over/underpriced options | Measure actual volatility |
| Relationship | Often moves with HV | Often moves with IV |
📌 Implied volatility is forward-looking and reflects market expectations, while historical volatility is backward-looking and measures what has already happened.
3. How Implied Volatility Reflects Market Risk and Uncertainty
Implied volatility is often described as the market’s “fear gauge” because it tends to rise when investors are worried and fall when they are confident. Here is how IV reflects market risk and uncertainty.
IV as a Fear Gauge
When markets are calm and investors are optimistic, implied volatility tends to be low. When uncertainty rises — due to geopolitical events, economic data releases, or financial crises — implied volatility spikes. This is because options become more expensive as investors seek protection against potential price swings.
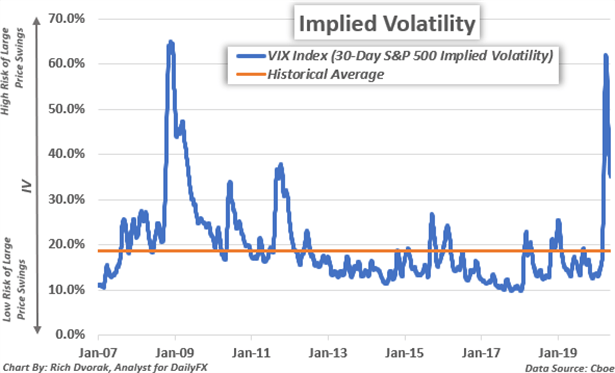
The VIX Index, often called the “Fear Gauge,” is the most well-known measure of implied volatility. It tracks the 30-day implied volatility of S&P 500 options and typically moves inversely to stock prices.
IV and Market Sentiment
Implied volatility can also provide insight into market sentiment. High IV suggests that investors are expecting significant price movements and are willing to pay a premium for options protection. Low IV suggests that investors are complacent and expect relatively stable prices. By monitoring IV, traders can gauge whether the market is pricing in too much or too little risk.
In forex, implied volatility can be used to assess market expectations for currency pairs. For example, if the implied volatility of EUR/USD options spikes, it suggests that traders expect significant movement in the euro-dollar exchange rate, perhaps due to an upcoming central bank meeting or economic data release.
4. Implied Volatility Trading Ranges — Support and Resistance
One of the most practical applications of implied volatility is calculating expected trading ranges. By using IV, traders can estimate where an asset is likely to trade over a given period.
The 68% Statistical Probability Rule
In a normal distribution, approximately 68% of observations fall within one standard deviation of the mean. Applied to trading, this means that there is a roughly 68% probability that an asset’s price will stay within one standard deviation of its current price over a given period. Implied volatility provides the standard deviation input for this calculation.
How to Calculate an Implied Volatility Trading Range
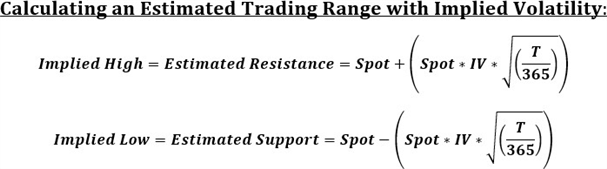
The formula for calculating an implied volatility trading range is:
- Upper Range = Spot Price + (Spot Price × IV × √(Days/365))
- Lower Range = Spot Price − (Spot Price × IV × √(Days/365))
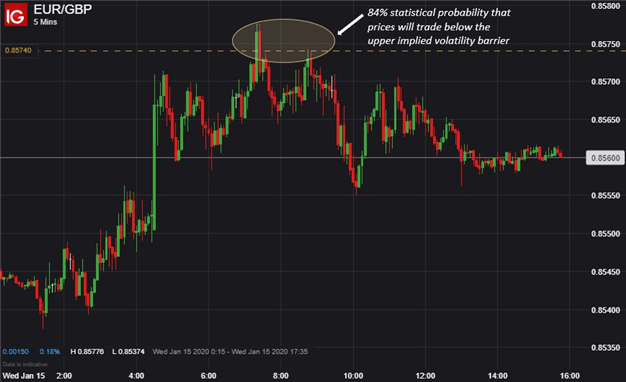
For example, if EUR/GBP is trading at 0.8541 and the 1-day implied volatility is 7.3%, the 1-day trading range would be:
- Upper Range: 0.8541 + (0.8541 × 0.073 × √(1/365)) = 0.8574
- Lower Range: 0.8541 − (0.8541 × 0.073 × √(1/365)) = 0.8508
Trading Range: 0.8508 – 0.8574
This means there is a ~68% probability that EUR/GBP will trade within this range over the next 24 hours.
5. How to Use Implied Volatility in Forex Trading
Implied volatility can be a powerful tool for forex traders. Here is a practical example of how to use IV in currency trading.
Real-World Example — EUR/GBP
Suppose EUR/GBP is trading at 0.8541. The 1-day implied volatility is 7.3%. Using the formula above, the 1-day trading range is 0.8508 – 0.8574.
As a trader, you could use this information to:
- Set profit targets: If you are long EUR/GBP, you might consider taking profits near the upper range (0.8574) and placing a stop-loss below the lower range (0.8508).
- Identify potential reversals: If price reaches the upper or lower bound of the IV range, there is a statistical probability that it will reverse, providing a potential entry or exit opportunity.
- Manage risk: By knowing the expected range, you can size your positions appropriately and avoid over-leveraging.
Step-by-Step Trading Strategy
- Identify the currency pair you want to trade.
- Find the 1-day implied volatility for that pair (available from options data or volatility indices).
- Calculate the trading range using the formula above.
- Set your entry and exit levels based on the range.
- Place your stop-loss just beyond the range to protect against unexpected moves.
- Monitor the price action and adjust your strategy as new information becomes available.
6. Implied Volatility in Commodities, Stocks, and Indices
Implied volatility is not limited to forex. It is used across all asset classes where options are traded, including commodities, stocks, and indices.
The OVX Index — Crude Oil Volatility
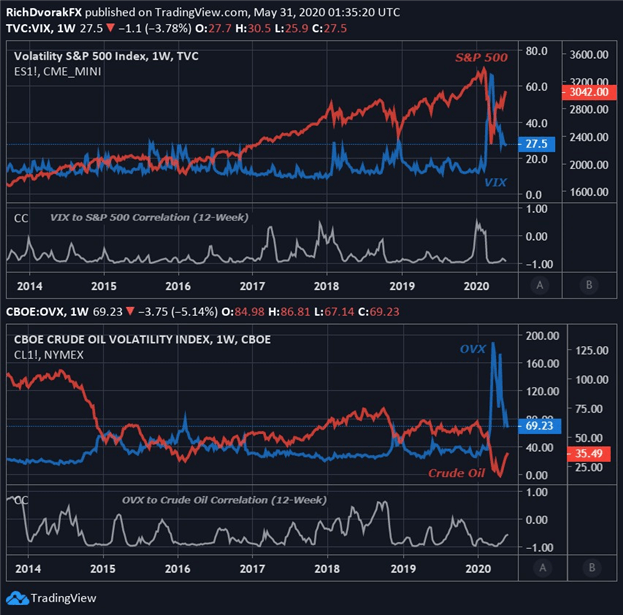
The OVX Index measures the 30-day implied volatility of crude oil options. Like the VIX, the OVX tends to spike during periods of geopolitical tension or supply disruptions. Crude oil traders use the OVX to gauge market expectations for oil price movements and to manage risk in their positions.
Cross-Asset Relationships
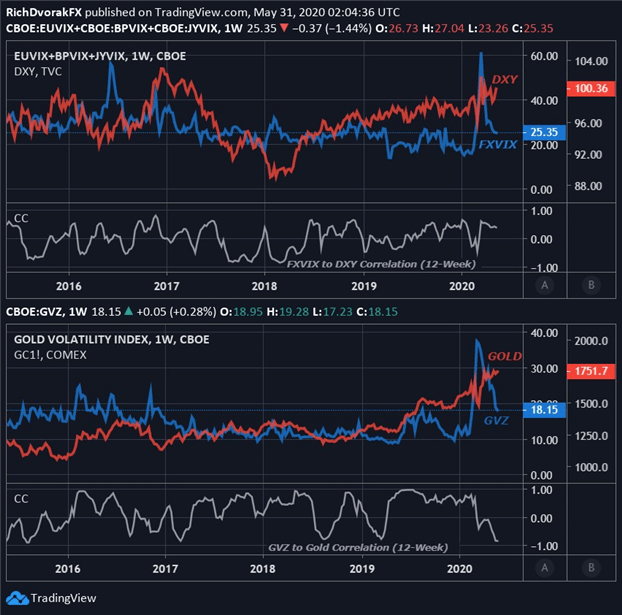
Implied volatility can also be used to identify cross-asset relationships. For example, when the VIX spikes, it often signals increased risk aversion, which can lead to a stronger US Dollar (as a safe-haven currency) and weaker commodity currencies like the Australian and Canadian Dollars. By monitoring implied volatility across multiple asset classes, traders can gain a more complete picture of the market environment.
7. The VIX Index — The Market’s Fear Gauge
The VIX Index, also known as the “Fear Gauge,” is the 30-day implied volatility of S&P 500 options. It is the most widely followed measure of implied volatility and is often used as a barometer of market sentiment.
- When the VIX is high: The market expects significant volatility and uncertainty. This typically occurs during market selloffs, economic crises, or geopolitical events.
- When the VIX is low: The market expects relatively stable prices and calm conditions. This typically occurs during bull markets and periods of economic stability.
- Inverse relationship: The VIX and the S&P 500 typically move in opposite directions. When stocks fall, the VIX tends to rise, and vice versa.
While the VIX is primarily used for equity markets, it has implications for forex traders as well. A spike in the VIX often leads to a flight to safety, benefiting safe-haven currencies like the US Dollar, Swiss Franc, and Japanese Yen.
8. Advantages and Limitations of Implied Volatility
Like any tool, implied volatility has both strengths and weaknesses. Understanding them is key to using IV effectively.
| Advantages | Limitations |
|---|---|
| Provides forward-looking market expectations | Can be influenced by market sentiment and fear |
| Helps identify over/underpriced options | May not accurately predict actual volatility |
| Useful for risk assessment | Complex calculation model |
| Can indicate market sentiment | Can be subject to volatility skew |
| Valuable for trading range identification | Requires options data (not always available) |
| Applicable across multiple asset classes | Can be misinterpreted by novice traders |
📌 Implied volatility is a powerful tool, but it should be used in conjunction with other forms of analysis. Never rely solely on IV for trading decisions.
9. Implied Volatility Reference Table
This reference table provides a quick summary of the key concepts related to implied volatility.
| Concept | Description |
|---|---|
| Implied Volatility (IV) | Forward-looking measure of expected price movement derived from options prices |
| Historical Volatility (HV) | Backward-looking measure of actual past price movement |
| VIX Index | 30-day implied volatility of S&P 500 options (the “Fear Gauge”) |
| OVX Index | 30-day implied volatility of crude oil options |
| GVZ Index | 30-day implied volatility of gold options |
| FXVIX | Implied volatility of the US Dollar Index (DXY) |
| IV Trading Range | 1-standard deviation expected price range based on IV |
| Black-Scholes Model | Options pricing model used to derive implied volatility |
📌 Implied volatility benchmarks are available for many asset classes, providing traders with valuable insight into market expectations across different markets.
10. Frequently Asked Questions
What is implied volatility?
Implied volatility (IV) is a forward-looking metric that reflects the market’s expectation of how much an asset’s price will move over a specified period. It is derived from options prices using the Black-Scholes model and is expressed as a percentage.
What is the difference between implied and historical volatility?
Implied volatility is forward-looking and reflects expected future price movements based on options prices. Historical volatility (realized volatility) is backward-looking and measures actual past price movements based on historical data.
How is implied volatility calculated?
Implied volatility is derived from options prices using the Black-Scholes options pricing model. It is the volatility input that makes the model’s theoretical price match the market price of the option.
What does a high implied volatility mean?
High implied volatility indicates that the market expects large price swings and increased uncertainty. It typically corresponds with higher options prices and elevated market risk.
What does a low implied volatility mean?
Low implied volatility indicates that the market expects relatively stable prices and low uncertainty. It typically corresponds with lower options prices and calm market conditions.
What is the VIX index?
The VIX index, also known as the “Fear Gauge,” is the 30-day implied volatility of S&P 500 options. It measures market expectations of near-term volatility and typically rises during market turmoil.
How can I use implied volatility in forex trading?
Implied volatility can be used to identify trading ranges (support and resistance levels), gauge market sentiment, and find potential inflection points. A common strategy is to trade reversals at the upper or lower bounds of the IV trading range.
What is an implied volatility trading range?
An implied volatility trading range is a 1-standard deviation expected price range calculated using the formula: Spot Price ± (Spot Price × IV × √(Days/365)). This range represents a ~68% statistical probability of where price will trade.
What is the relationship between implied volatility and options prices?
Implied volatility has a direct positive relationship with options prices. When implied volatility rises, options prices increase (assuming all other variables are constant). When IV falls, options prices decrease.
What is the difference between VIX and implied volatility?
VIX is a specific measure of implied volatility for the S&P 500. Implied volatility is a broader concept that can be calculated for any asset with options. VIX is essentially the implied volatility of S&P 500 options.
📊 Volatility in the Real World: Implied volatility is not just a theoretical concept — it manifests in real market movements. Read our Weekly Economic & Financial Commentary on how interest rate volatility reached near decade-high levels in 2022, creating significant trading opportunities across currencies, bonds, and equities.
📉 Volatility in Action — EUR and GBP Crosses: See how implied volatility played out in real market conditions with our analysis of downside breakouts in Euro and Sterling crosses — a practical case study showing how currency volatility can create breakout opportunities and how traders can position themselves to capitalise on these moves.
 Signal2forex.com - Best Forex robots and signals


