Using the RSI indicator – key things you need to know:
In a downtrend, RSI can remain oversold
- Use the centerline to determine market direction
- RSI settings can be adjusted for more or less oscillation
What is RSI (Relative Strength Index)?
RSI (Relative Strength Index) is counted among trading’s most popular indicators. This is for good reason, because as a member of the oscillator family, RSI can help us determine the trend, time entries, and more.
The Relative Strength Index (RSI) was developed by J. Welles Wilder to measure the speed and change of price movements. RSI oscillates and is bound between zero and 100. There are many different uses for RSI and by far the most popular is trading overbought and oversold crossovers.
To help become better acquainted with the RSI indicator and the different settings, we will review three uncommon tips for trading with RSI.
Think beyond the crossovers
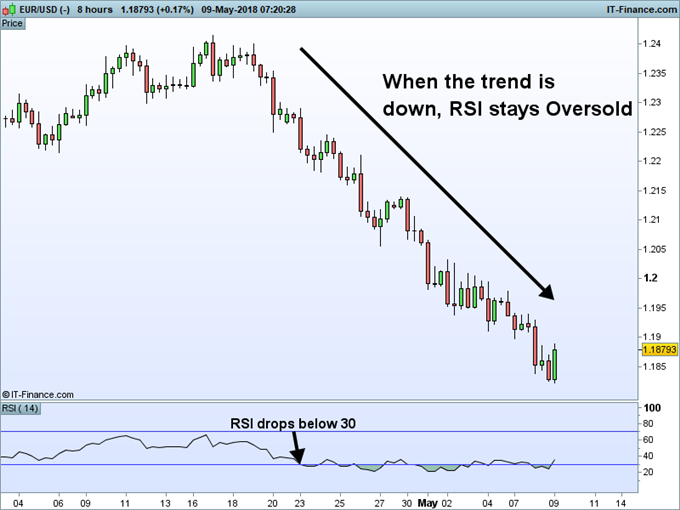
When traders first learn about RSI and other oscillators, they tend to gravitate to overbought and oversoldvalues. While these are intuitive points to enter in the market on retracements, this can be counterproductive in strong trending environments. RSI is considered a momentum oscillator, and this means extended trends can keep RSI overbought or oversold for long periods of time.
The below image is a prime example using RSI on a EURUSD 8 hour chart. Even though RSI dropped below a reading of 30 price continued to decline as much as 300 pips.. This could have spelled trouble for traders looking to buy on a RSI crossover from oversold values. Instead consider the alternative and look to sell the market when RSI is oversold in a downtrend, and buying when RSI is overbought in an uptrend.
Watch the center line
All oscillators have a center line and more often than not, they become a forgotten backdrop compared to the indicator itself. RSI is no different, with a center line found in the middle of the range at a reading of 50.
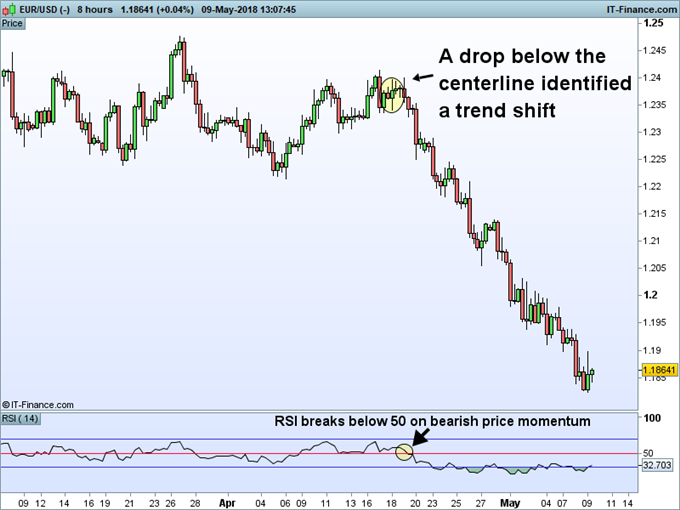
Technical forex traders use the centerline to show shifts in the trend. If RSI is above 50, momentum is considered up and traders can look for opportunities to buy the market. A drop below 50 would indicate the development of a new bearish market trend.
In the graph below you can again see our EURUSD example using an 8 hour chart. Notice that when price pushed upward, RSI remained above 50. Even at times, the center line acted as indicator support as RSI failed to break below this value in the middle of April prior to the creation of another high. However, as momentum shifted, RSI dropped below 50 indicating a bearish reversal. Knowing this, traders could conclude any existing long positions, or look for order entries with prices new direction.
Check your parameters
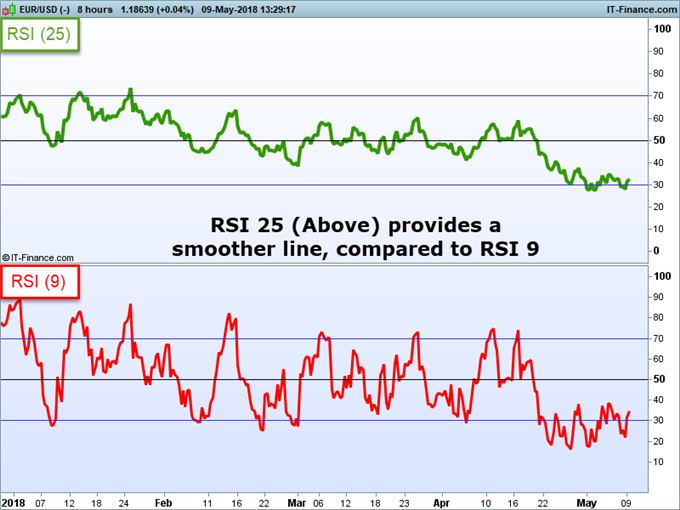
RSI like many other oscillators is defaulted to a 14 period setting. This means the indicator looks back 14 bars on whatever graph you may be viewing, to create its reading. Even though 14 is the defaulted setting that may not make it the best setting for your trading. Normally short–term traders use a smaller period, such as a nine period RSI, to replicate shorter term movements in the market.. Longer–term traders may opt for a higher period, such as a 25 period RSI, for another indicator line.
In our final comparison, you can see in the graph below a nine period RSI line side by side with a 25 period RSI line. While there may not seem like much difference at first glance, pay close attention to the centerline along with crossovers of the 70 and 30 values. The RSI nine at the top of the graph has considerably more oscillation compared to its RSI 25 counterpart.
RELATIVE STRENGTH INDEX FAQS
What are other useful tools to use with the Relative Strength Index (RSI)?
As the name implies, RSI is simply measuring relative strength of the underlying market. When using RSI to identify reversals it is important to incorporate other tools like candlestick analysis or trend line analysis. For example, if you find are reading a reversal candlestick near a trend line while RSI is diverging, then you have a trading signal being generated.
What markets can RSI be applied to?
Since RSI measures the relative strength of the underlying market, it is a technical tool that can be applied to nearly any market. However, it is commonly applied to the more liquid and larger markets like forex, stocks, and commodities. Follow our three steps to buying the dip or selling the rally to bring more an edge to your strategy.
Interested in learning more about forex trading and strategy development? We developed a new to forex guide to help you get started. If you are more experienced, make sure to read our Traits of Successful Traders research on a big mistake traders make and why they lose money.
Lastly, signup for a series of free Advanced Trading guides, to help you get up to speed on a variety of trading topics.
You might also be interested in….
*3 thinks I wish I knew when I started trading forex
*4 effective trading indicators every trader should know
Link to the source of information: www.dailyfx.com
 Signal2forex.com - Best Forex robots and signals


