Today, we discussed several types of pullback scenarios, with three main categories – post-breakout, mid-trend, and after a trend reversal for a counter-trend trade. We covered the various aspects to identifying the highest probability set-ups and took a look at several examples, examining both the analytical and trade management side of these set-ups.
Whether you are a new trader building a foundation or an experienced trader struggling (happens to the best), here are 4 ideas for Building Confidence in Trading
Post-Breakout Pullback
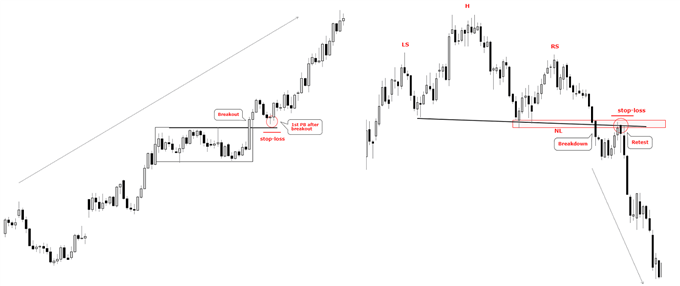
The post-breakout pullback set-up arrives, well, following a breakout (last week we discussed breakouts in detail). Once a breakout has taken shape, many times you will see a retest of the breakout level, and when this happens a low-risk entry can be taken in the direction of the breakout. One can enter upon a retest of the breakout level or wait for confirmation that momentum is turning back in the direction of the intended trade by using candlesticks. Stops should be set beyond the retest (below support for longs and above resistance for shorts).
Even if there is no actual retest of the breakout level, the first pullback typically has the highest probability of success. A turn in momentum once the pullback has ended provides the trader with a swing low (for longs) or swing high (for shorts) from which to place stops.
Examples of Post-breakout Pullbacks

Created with Tradingview
Mid-trend Pullback
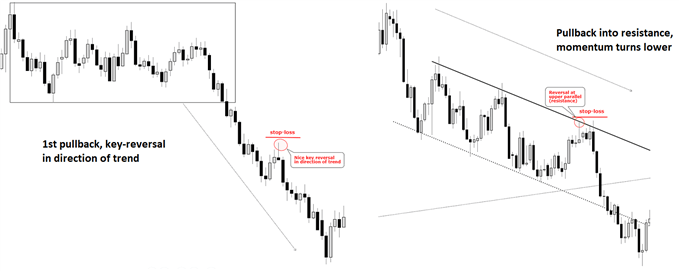
By mid-trend pullback, we mean within an ongoing trend; that is, within a price sequence of higher highs and higher lows (uptrend) or lower lows and lower highs (downtrend). In a strong trend, a pullback may not take price down or up to a key level(s), which is why watching price action via candlesticks can be quite helpful in these instances. (More on candlestick analysis.)
A pullback which ends with a key-reversal, for example, provides a signpost that the pullback has drawn to a conclusion. If, for instance, we have an uptrend and the market declines but ends abruptly with a bullish key-reversal, it’s a good sign momentum wants to turn back in favor of the prevailing trend. Flip the script upside down for trades from the short-side.
There will be many set-ups, though, which have good levels to operate off of during the pullback (support for longs, resistance for shorts). These levels can be price, trend-lines, slopes, Fibonacci, moving averages, etc. (In the webinar we focused on price, trend-lines, and slopes.) The idea here is simple – use those levels as spots for entry as long as they hold as valid. As per usual, confluence between various types of support and resistance builds a stronger case that you are watching an important zone, or inflection point.
As is the case with any of these, taking it a step further and using candlesticks can be a powerful way of confirming price action at identified support and resistance. In addition, stop losses should be placed beyond the level in question (< swing low for longs, > swing high for shorts).
Examples of mid-trend pullbacks

Created with Tradingview
Pullback after possible trend reversal, countertrend
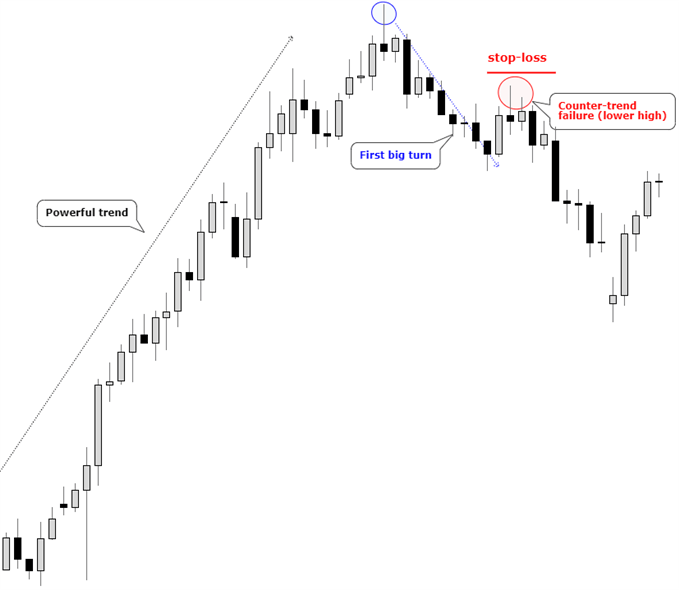
This strategy is employed when looking for trends that may be on the verge of reversing or at least undergoing a larger countertrend correction in an exhausted market. Taking this approach is much safer than trying to buy the low or short the high of a strong trend.
First, you wait for a strong reversal to develop and then watch the subsequent pullback for signs of momentum turning back in the direction of the reversal. It’s simply waiting for the development of a higher low or lower high, depending on whether a bullish or bearish setup. Again, candlesticks here are a good way to identify changes in momentum. Stops should be placed beyond the swing low or high.
Example of Countertrend Trade, lower high

Created with Tradingview
We understand the difficulties of trading, which is why we’ve put together a variety of guides designed to help traders of all experience levels.
Risk management
As is the case with any trade set-up, there must be good risk parameters in place. As discussed last week, the distance from your entry point to anticipated target and distance from entry to stop-loss should have an asymmetrical profile which gives you a good risk/reward ratio (i.e. – 1:2+).
We didn’t delve too much into setting targets, but the principle of targets is as such – use your analysis to decide on where the trade is most likely to end up, or where you believe the move could stall and reverse. For example, if you are long you want to identify potential obstacles (resistance) as places to set your targets, and vice versa for shorts. Along the way towards extended targets, given the trending nature of most of these set-ups, you may want to also implement a type of trailing stop to help you extend winners beyond predetermined targets.
Enjoy the video? Join Paul or any of the team’s analysts live each week for webinars covering analysis, fundamental events, and education.
For the full conversation and examples, please see the video above…
Past recordings you might be interested in: Creating a Trading Plan; Handling Drawdowns; Risk Management; Analysis, keeping it simple; 6 Mistakes Traders Make; Focusing on the Process; Building Consistency; Classic Chart Patterns, Part I; Classic Chart Patterns, Part II
—Written by Paul Robinson, Market Analyst
You can follow Paul on Twitter at @PaulRobinsonFX

 Signal2forex.com - Best Forex robots and signals


