As US stock indices break fresh highs, the question on everyone’s mind is how much longer the current bull market can continue. The remarkable resilience of US equities to trade tensions and rising interest rates, combined with a robust US economy, suggest the late-cycle party is unlikely to end over the coming months. Looking further ahead into 2019 though, the outlook becomes much more clouded, warranting a more prudent approach.
After an inflation scare spooked equity investors in the early stages of the year, leading to nearly a 12.5% correction lower in both the S&P 500 and the Nasdaq, these major stock indices managed to stage a remarkable comeback – touching fresh record highs in late August. The extraordinary aspect of this recovery was that it occurred despite heightened trade tensions between the world’s largest economies, and in an environment where almost all major central banks are either raising interest rates or have announced plans to withdraw crisis-era monetary stimulus. Higher rates, in turn, push the yields on government bonds higher, rendering bonds increasingly more attractive to hold and curbing some demand for stocks.
To be fair, there are several encouraging factors pulling investors towards US stock markets. First and foremost, the US economy remains robust, easily outperforming all its major counterparts in terms of economic growth. Then, there’s the particularly strong earnings US companies have been reporting in recent quarters, with the latest tax cuts from the Trump administration painting a rosier picture for corporate profitability. Meanwhile, several large firms including the likes of Apple have been using most of the cash the tax overhaul has saved them to increase the amount they allocate to buying back their own shares, thereby propping up their stock prices.
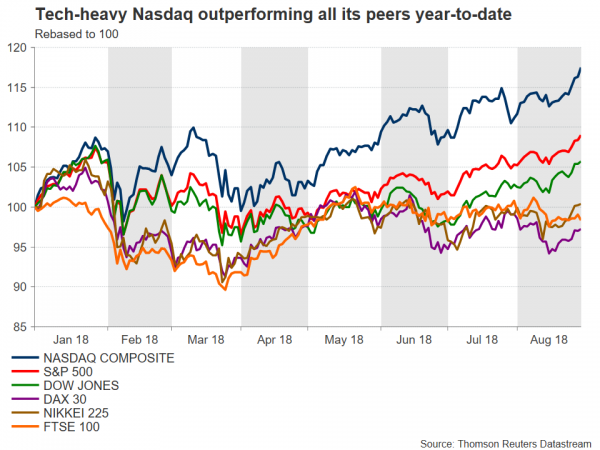
Year-to-date performances
While most major markets rebounded following the late-January tumble, some have recovered much more than others, with US indices and specifically tech stocks being favored by investors. Looking at year-to-date performances, the tech-heavy Nasdaq indices are clearly leading their peers, with the Nasdaq 100 and the Nasdaq Composite being up by 19.5% and 17.2% respectively. For comparison, the S&P 500 has gained 8.5%, while the Dow Jones is higher by 5.1%. Outside of the US, though, major European and Asian benchmarks are struggling. Japan’s Nikkei 225 is up by a fractional 0.4% in the year, Germany’s DAX 30 is down by 3.2%, while the UK’s FTSE 100 is 2.2% lower.
Valuations
Interestingly enough, investors are piling into US markets and tech shares even though these stocks are considered “expensive” by a number of valuation measures. To explain, looking at a simple valuation metric, the one-year forward price to earnings (PE) ratio, the Nasdaq 100 appears to be the most “overvalued” index, with a ratio of 22.5. This ratio denotes the dollar amount someone would need to invest in order to receive back one dollar of earnings. Therefore, the higher it is, the more “expensive” an index or a stock is thought to be. It bears mention though, that a high PE may also be attributed to high growth prospects for a given stock or index.
Next on this list is the Nasdaq Composite, with a forward PE ratio of 21.78. The S&P and the Dow come in at 17.97 and 16.68 correspondingly. For the record, the longer-term average for the S&P 500 rests around the 15.0 mark. Meanwhile, the Nikkei, DAX, and FTSE stand at somewhat more moderate levels of 16.2, 12.9, and 13.3 respectively.
A closer inspection of these measures though, reveals stark differences across sectors, with technology stocks easily outperforming and dragging the broader indices higher. Taking the S&P 500 as an example, while the broader index is up by 8.5% in the year with a forward PE of around 18.0, its sub-index covering IT companies is higher by 19.83% year-to-date with a more elevated PE ratio of 20.8. To answer why the technology sphere is doing so much better than the broader market, it’s fruitful to consider the side-effects a “trade war” could generate. Other things equal, increased trade barriers across economies could hurt companies producing physical goods disproportionally more than those producing digital ones. On top of the extremely high growth and scale potential most tech firms enjoy, this may have been yet another factor drawing investors towards the sector.
Can the bull run continue, and if not, what could halt it?
Not only are US equity indices like the S&P 500 at all-time highs, the current bull market (dating from March 2009) is now also the longest on record, meaning there has never been a longer period of stock market gains without a 20% downward correction. By itself, this statement doesn’t mean much. Just because a bull market has been running longer than others, does not necessarily imply it has to end soon – it could continue for years still. That said, the combination of all-time highs and the lengthiest bull run has investors questioning whether or not US stocks are still a “buy” from here.
Several factors are likely to determine when, and at what levels, the current rally ends. The obvious risk relates to trade, and the potential for further escalation in tensions. So far though, markets have taken worrisome trade news in their stride, siding with the view that although there may be some turbulence while the US renegotiates its trade relationships, the end-game remains a “grand deal” and not a prolonged trade war. Hence, for US stock indices to materially decline, it may take a much greater escalation in the trade skirmish that impacts the broader US economy, not just the few industries affected so far.
Then, there’s interest rates. As mentioned above, in an environment of central banks raising rates and governments like the US running massive fiscal deficits, bond yields tend to go up – making bonds more attractive as they begin to offer a higher and “safer” return. This typically leads investors to rebalance their equity-to-bonds exposure, thereby curbing demand for stocks. However, this has not transpired either, not yet at least. For all the talk of rising yields by renowned investors like Bill Gross at the beginning of the year, 10-year US Treasury yields remain stubbornly below the 3.0% handle, providing a relatively modest incentive for investors to switch to bonds.
US elections on tap
Another risk event for US stocks are November’s midterm elections for both Houses of Congress. Historically, the party that is outside the White House gains seats in the midterms, and polls so far confirm this trend will likely continue this year. Given that Republicans have traditionally been viewed as market-friendly, Democrats gaining power may weigh on US equity markets, with the magnitude of a potential decline probably depending on how much the Democratic party increases its legislative power.
However, a resulting fall may constitute a knee-jerk reaction, providing opportunities to buy the dip, especially in case of a considerable bearish movement. This, on the expectation that the economy will ultimately not be materially affected. Another scenario that may play out, is that markets overall are not hurt much, with sectoral rotation only taking place. For example, stronger Democrats may be seen by investors as decreasing the odds for deregulation in the banking sector. This, in turn, could result in funds rotating out of financials and into other sectors that are seen as having strong growth potential, for example tech stocks.
Finally, a tail risk for markets – referring to something with a small probability of occurring – is that of a recession or an economic slowdown. Although nothing like that appears imminent, over the next months at least, several pundits are worried that heading into 2019 such risks may grow significantly. The economic cycle is already at a late stage, and combined with increasingly tighter US monetary policy, fading fiscal stimulus, and trade risks, some caution appears warranted.
Bulls remain in charge, but closing of monetary taps generates risks
In the grand scheme of things, the picture for the S&P and the Nasdaq remains bright, for this year at least, with another leg up in the late-cycle rally not to be ruled out. Moving into 2019, however, a more defensive stance may be prudent. The ECB has signaled it will begin raising interest rates late next year, and with the Fed doing the same, that will likely dry up some of the extreme liquidity that has characterized the past years, potentially acting as a drag to further stock market gains and hence creating asymmetric risks for equities.
Technical outlook
Taking a technical look at the benchmark S&P 500, the index touched a record high of 2,916.5 on August 29, and has since pulled back slightly. The price structure on the daily chart remains higher highs and higher lows above both the 50- and the 200-day moving averages and hence, the broader bullish trend appears intact. That said, short-term oscillators like the RSI suggest positive momentum may be losing steam, generating the risk that the latest retreat may continue in the immediate term.
In case of a correction lower, immediate support to declines may be found near the previous all-time high of 2,873, recorded on January 26. A downside break could open the way for the 2,802 area, marked by the lows of August 15 – with the round figure of 2,800 and the 50-day moving average at 2,811 also being part of this area. Even lower, declines may stall near 2,692, the June 28 trough.
On the upside, a break above the all-time high of 2,916.5 would bring the index into uncharted territory, with the next figure to offer resistance potentially being the psychological number of 3,000. If the bulls pierce it, then the attention would increasingly turn to the 3,084 hurdle, which is the 161.8% Fibonacci extension of the January 29 – February 9 drop, with a high at 2873 and a low at 2532.
 Signal2forex.com - Best Forex robots and signals


