The market may begin looking different after Labor Day.
Even though stocks just completed a banner month, the Economic Cycle Research Institute’s Lakshman Achuthan is waving a warning flag.
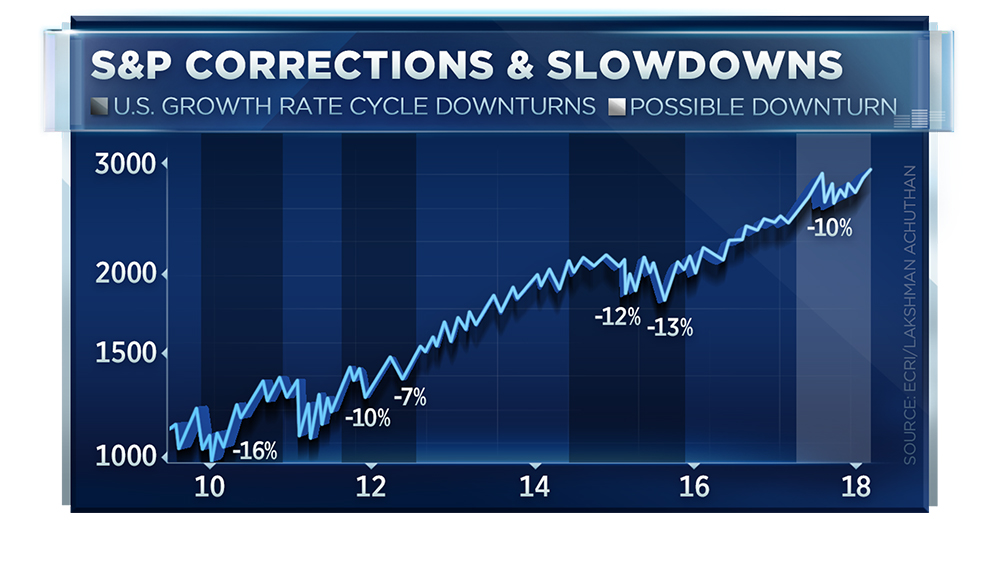
Achuthan believes there’s a heightened risk of a sell-off that could wipe out the recent all-time highs. He used a special chart of the S&P 500 over time on CNBC’s “Trading Nation” to make his case.
“What’s unique about this chart is that we’ve marked off the slowdowns in the economy — the so-called growth rate cycle slowdowns,” the institute’s co-founder said Friday. “The shaded areas are when the economy is decelerating, and that is a period of time when the risk, more often than not, is that you’re going to see some sort of correction in the order of 10 to 20 percent.”
According to Achuthan, economic growth likely peaked in 2017. He estimates he’ll have enough data to make an official call before winter.
“The slowdown is, I think, very real and will become more apparent in the coming months,” he said.
Yet, stocks are trading around all-time highs. The tech-heavy Nasdaq just saw its strongest August performance since 2000, and consumer confidence is also at 18-year highs.
“Some will remember back in the fall of 2000, the market didn’t do so well afterwards,” noted Achuthan, who has been accusing Wall Street of being too optimistic this year.
On May 21, the former self-proclaimed super bull said the economy was “cruising for a bruising.” Since that “Trading Nation” appearance, the S&P 500 is up 7 percent.
However, he’s not wavering from his slowdown call — noting that he’s not predicting a full-blown recession.
“I would just say you have to manage your cyclical risk. It’s not an all clear signal here,” Achuthan said. “It’s a directional call. Again, there’s no recession. It’s a slowdown.”
 Signal2forex.com - Best Forex robots and signals


