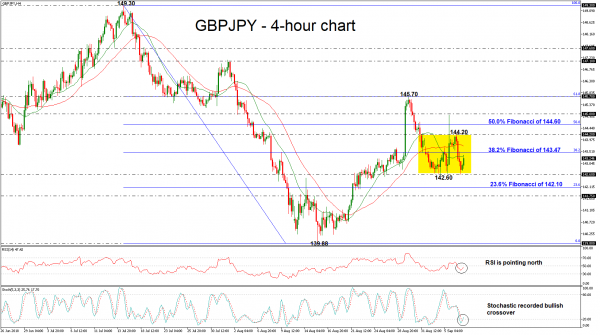
GBPJPY has been moving in a narrow range with an upper boundary the 144.20 resistance level and lower boundary the 142.60 support level, over the last week. Currently, the price is moving higher with the RSI confirming this movement as it is approaching the bullish area. Furthermore, the %K line of the stochastic oscillator created a bullish cross with the %D line in the oversold zone, which is a strong buying signal for traders.
Immediate resistance is being provided by the 38.2% Fibonacci retracement level of the downleg from 149.30 to 139.88, near 143.47. A successful leg above this region would open the way for the next resistance at the latest highs of 144.20. Also, a higher jump would ease the downside pressure and drive the pair until the 50.0% Fibonacci of 144.60.
Should the market post losses, support could be met at the lower boundary of 142.60, which the market failed to penetrate several times in the past. If the bears take charge and drop below it, the 23.6% Fibonacci is one of the major support levels at 142.10 before the 141.75 barrier.
Overall, GBPJPY remains below the 20- and 40-simple moving averages (SMAs) in the 4-hour chart and a climb above these lines could confirm the scenario for short term upside tendency.


 Signal2forex.com - Best Forex robots and signals


