Both precious metals have extended their recent gains with gold trading at $1230 and silver at $14.75 at the time of writing. Silver in particular is looking quite interesting from a bullish point of view. Although it has lagged behind gold, the grey metal could be about to outperform the yellow. Silver was grinding higher for the fourth consecutive session on Tuesday while gold was up for the second day after a brief pause on Friday. Meanwhile, the Dollar Index had broken below the 95.00 support level to trade at its lowest point since September 27. Thus, the buck-denominated metals’ gains were largely due to a weaker US dollar. The greenback has struggled in recent weeks due to foreign currencies finding stronger support. For example, the British pound and euro have firmed because of stronger UK data and hopes that a Brexit deal could be achieved in the coming days, while the Japanese yen has been boosted by safe haven flows owing to last week’s sell-off in the stock markets. Rising interest rate expectations have meanwhile boosted the Canadian dollar, causing the USD/CAD to slump back below the 1.30 handle yesterday.
Thanks to the pause in the dollar rally, silver managed to end a three-month losing streak in September when it bounced strongly off long-term support around $14.00. Although silver then went into a two-week consolidation, it has now started to push higher again.
As a result of the recent recovery, silver has formed some bullish-looking price patterns on its charts. Take for example the weekly chart, below. As can be seen, silver held its own above long-term support at $14.00 and we have had a good reaction from there, suggesting that the buyers stepped in to take advantage of the beaten down prices. Last week’s price action has resulted in the creation of a bullish-looking doji candle. Crucially, silver has now enjoyed some bullish follow-through at the start of this week. Thus, price action appears overall bullish as things stand. Therefore we are expecting dips to be defended until silver meets strong downward pressure from higher resistance levels. Near-term resistance comes in at $15.20, a prior support level, followed by a more significant level around $16.20-$16.50 – the latter marking the convergence of several factors including the bearish trend line and the 55-week moving average. In terms of support, last week’s high and therefore the doji candle’s head comes in around $14.70. This level better hold now, else the bulls could get into trouble again.
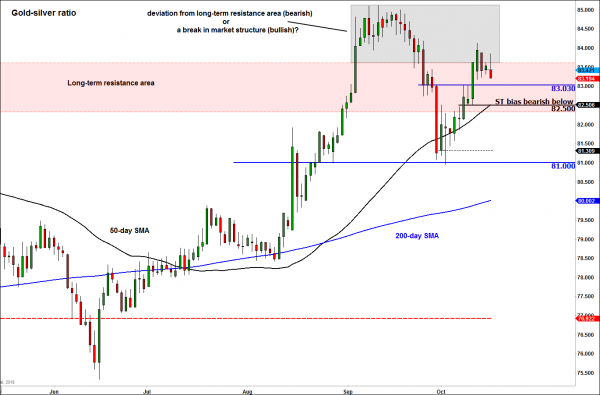
Meanwhile the gold-silver ratio (chart below) may have created a top when its attempted breakout above the old resistance area of 82.30-82.60 failed. If that was a genuine bearish reversal (i.e. a false breakout) then a move below the lower bound of this zone would be bearish for the gold-silver ratio and bullish for silver on a relative basis. Thus, silver bulls would now like to see a breakdown in the gold-silver ratio, for this could accelerate the potential gains for the grey metal.


 Signal2forex.com - Best Forex robots and signals


