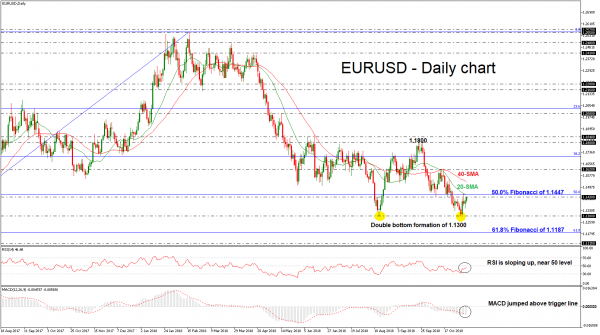
EURUSD re-challenged the 14-month low of the 1.1300 strong psychological level in the previous week, creating a double bottom formation. The price rebounded on it, heading north towards the 50.0% Fibonacci retracement level of the upleg from 1.0340 to 1.2550, which overlaps with the 20-day simple moving average (SMA) at 1.1447. The RSI indicator is approaching the threshold of 50 with strong momentum, while the MACD oscillator stands above its trigger line in the negative zone.
Immediate resistance to focus on is the 1.1430 and the 50.0% Fibonacci mark, while a jump higher could hit the 40-day (SMA) at 1.1535. Then, if the market fails to hold below these levels, the next stop could be at the 1.1620, reached on October 16.
If the pair bounces down again, the initial support to have in mind is the 1.1300 handle. Steeper declines could send prices until the 61.8% Fibonacci region of 1.1187, while even lower the 1.1115 support, could provide some support to investors, taken from the trough on June 2017.
To conclude, EURUSD seems to be in a bearish correction mode following the pullback on the 1.2550 resistance barrier on February 11. The long-term view is negative and a slip below the 61.8% Fibonacci would endorse the bigger negative picture as well.


 Signal2forex.com - Best Forex robots and signals


