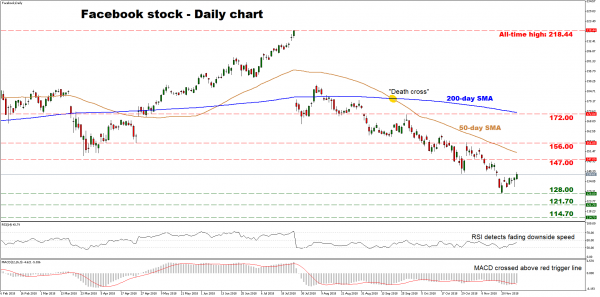
Facebook’s stock saw a dramatic collapse after touching an all-time high of 218.44 in late July, falling below its 50- and 200-day simple moving averages (SMAs) to find support near the two-year low of 128.00 on November 20, and subsequently rebounded. With the price structure now consisting of lower peaks and lower troughs below the SMAs, the medium-term picture seems firmly negative.
Short-term oscillators however, suggest the current rebound may continue in the immediate term. The RSI is detecting fading downside momentum, while the MACD has just crossed above its trigger line; a bullish signal.
Further recovery in the stock may encounter resistance near the 147.00 zone, marked by the inside swing low on November 5. An upside break could open the way for the round figure of 150.00, where the 50-day SMA is also located. Another bullish move would turn the picture to a more neutral one, setting the stage for a test of the October 31 peaks at 156.00.
On the flipside, another wave of losses could stall near the two-year low of 128.00, with a bearish break seeing scope for a test of the 121.70 area, defined by the highs of December 2016. Even lower, the 30, December 2016 low of 114.70 would attract attention.
Summarizing, the medium-term outlook remains negative, though momentum oscillators suggest the latest rebound may continue in the immediate term.


 Signal2forex.com - Best Forex robots and signals


