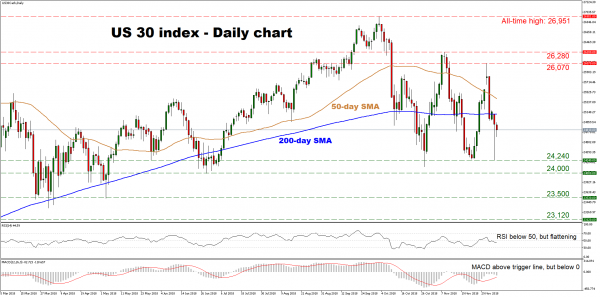
The US 30 index remains on the back foot, having crossed back below its 50- and 200-day simple moving averages (SMAs) in recent sessions. The price structure of lower highs on the daily chart suggests the bias is negative at the moment, but not clearly so, as the SMAs are converging; an indication the longer-term picture is turning more neutral.
Short-term oscillators support the case. The RSI – although below its neutral 50 line – seems to be flattening, while the MACD remains above its red trigger line, albeit in negative territory.
Further declines may meet initial support near the December 6 low of 24,240. A downside break could open the way for the 24,000 handle, which halted the drop in June. Even lower, the May 3 low of 23,500 would attract attention.
On the flipside, advances could stall first around the 200-day SMA at 25,110, and subsequently near the 50-day SMA at 25,400. A bullish break could see scope for a test of the December 3 peak of 26,070, before the November 11 high of 26,280 comes into view.
In brief, the short-term bias looks cautiously negative, but the broader picture is shifting to neutral.


 Signal2forex.com - Best Forex robots and signals


