
By Uladzimir Leuchankou, founder of Signal2Forex · 7 November 2026
What is forex correlation? It is a number from −1 to +1. The number shows whether two currency pairs rise and fall on the same days. I suppose that is an answer too.
But for me correlation in forex is a risk question — how many separate trades do I hold, and how many of them are the same trade twice? From 10 August to 5 November 2026, EUR/USD and GBP/USD had a correlation of +0.84. A buy on both was close to one position at double size.
| Pairs | Correlation | In a trade |
|---|---|---|
| EUR/USD and GBP/USD | +0.84 | Two buys act as one large buy |
| USD/CHF and USD/CAD | +0.64 | Often the same dollar move |
| AUD/USD and NZD/USD | +0.59 | Related, but each has its own days |
| EUR/USD and USD/JPY | −0.40 | A weak opposite link |
| EUR/USD and USD/CHF | −0.59 | Opposite on most days, far from −0.95 |
Correlation of daily changes, 10 August – 5 November 2026. Source: ECB reference rates, my calculation.
Forex pairs correlation chart
Most people look for a forex pairs correlation chart first. So here is mine. I took the daily euro reference rates of the European Central Bank from 10 August to 5 November 2026 — 64 fixings, 63 daily changes. From the euro rates I calculated seven dollar pairs. Every number on this page comes from that one file.
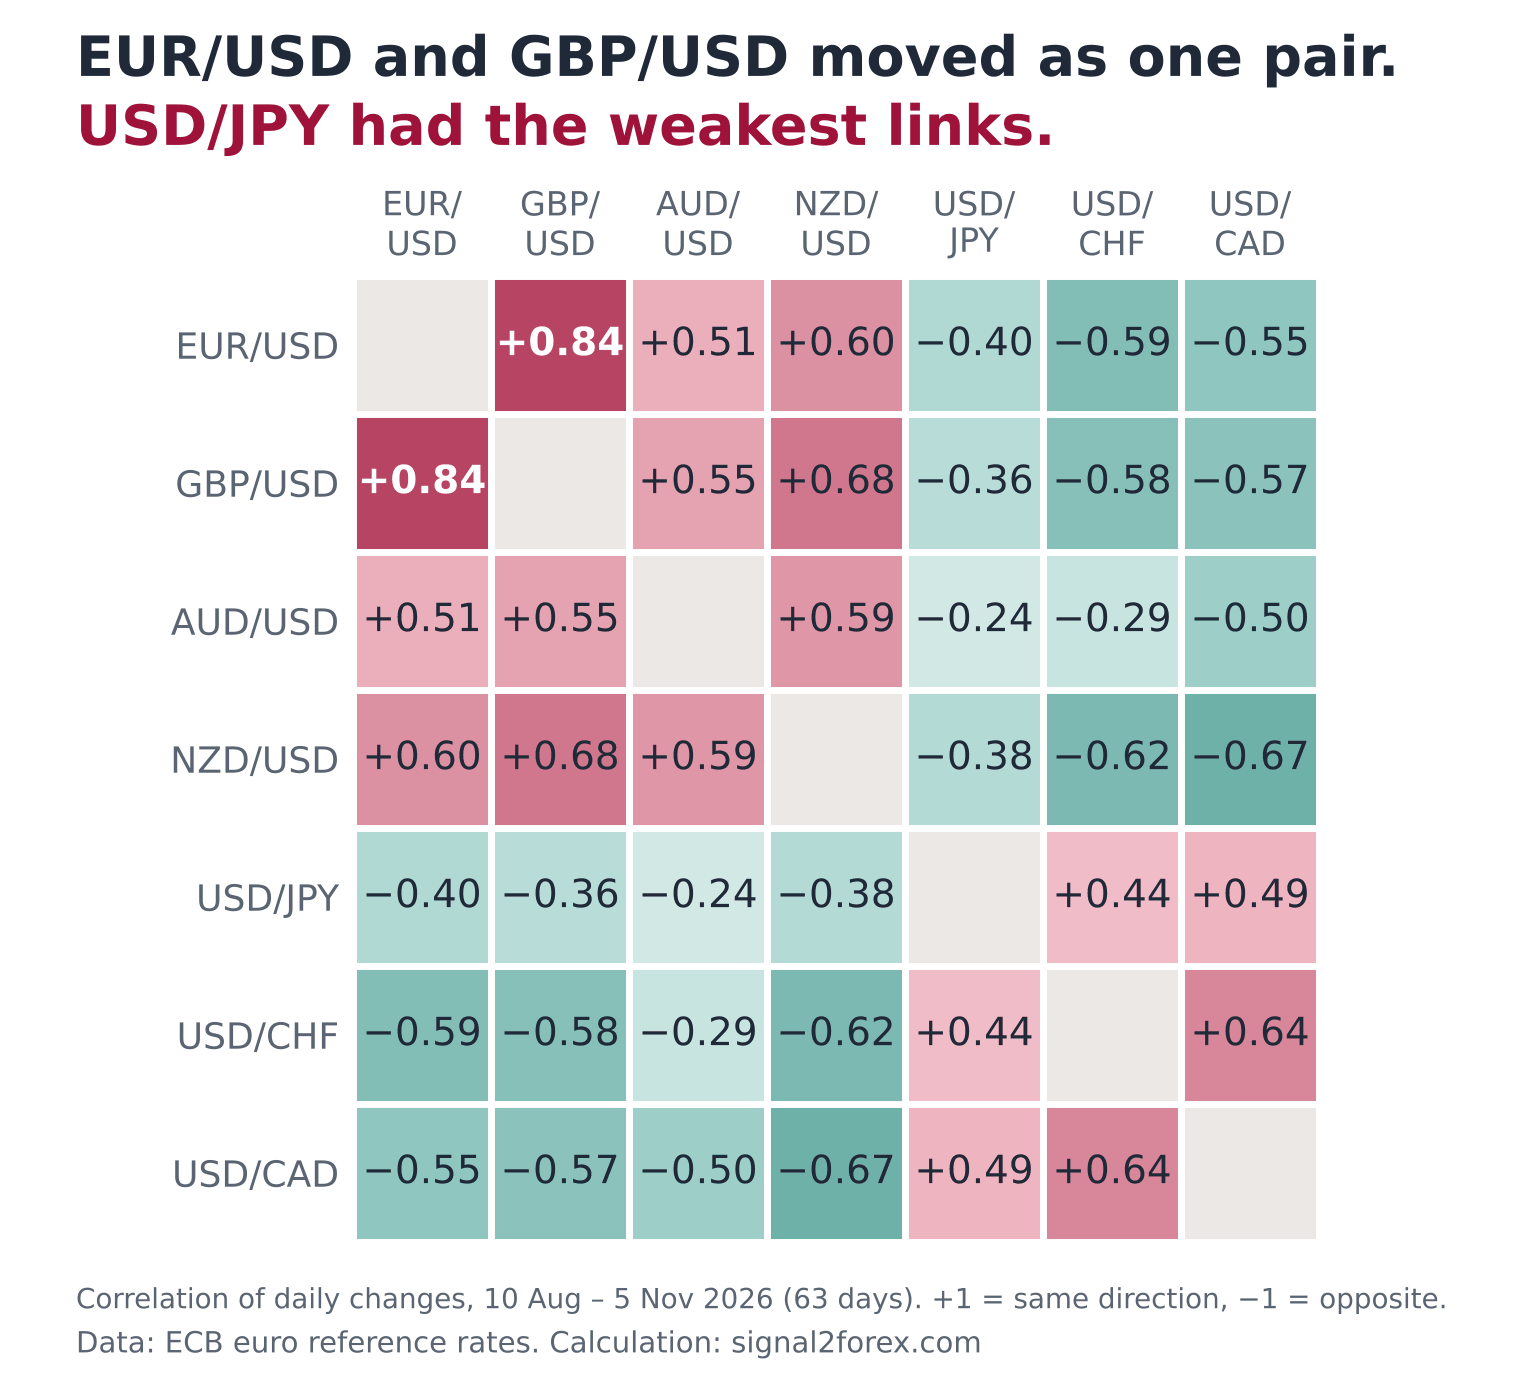
Why do the pairs fall into two groups? The dollar sits in all seven. The BIS Triennial Survey counted the US dollar on one side of 89.2% of all currency trades in April 2025. So a large part of forex market correlation is one thing — the dollar itself. When the dollar gains, EUR/USD, GBP/USD, AUD/USD and NZD/USD tend to fall together. USD/JPY, USD/CHF and USD/CAD tend to rise together.
Look at the USD/JPY row. No link in that row reaches 0.5. The yen had its own days in these three months, and USD/JPY came closer to an independent pair than any other in the chart. This matters when you choose a second pair to trade. A pair from the same group adds size. A pair like this one adds a different bet.
Older versions of this page gave fixed numbers for USD/CAD and oil, and for AUD/USD and gold. I removed them. My file has currencies only, so I did not measure those links, and I do not want to print a number I did not check. The method is the same for any market — daily changes of one against daily changes of the other, for the dates you trade.
Forex correlation in one number
The number itself is the Pearson coefficient. At +1 two pairs move in the same direction every day. A value of −1 means opposite directions every day. Zero means one pair tells you nothing about the other. For my own work I use two borders. Above +0.7 or below −0.7 I treat two pairs as one. Between −0.3 and +0.3 I treat them as separate. Everything in between is a partial link.
You do not need a website for this. In MetaTrader 5 the standard library has a ready function — MathCorrelationPearson. You give it two arrays of daily changes — 20 values for a short window, 63 for a quarter — and it returns the coefficient. Different windows give different forex correlations, and both are correct. They answer different questions.
Which window do I believe? I compare them. Over 63 days EUR/USD and GBP/USD had +0.84, over the last 20 days +0.81 — a stable link. AUD/USD and NZD/USD went from +0.59 to +0.43. EUR/USD and USD/JPY went from −0.40 to −0.18. When the short number and the long number agree, I trust the pair. When they do not, I trust neither and cut the size.
Prices against daily changes
Here is where I disagree with many fx correlation tables. They compare prices. I compare daily changes. Two pairs can both drift down for three months for different reasons, and a price comparison will call them twins. In my file EUR/USD and AUD/USD show +0.87 on prices. On daily changes the same two pairs show +0.51. The first number describes a shared trend. The second describes what happens to your account tomorrow.
There is another catch, and it works the other way. A high number says nothing about the size of the move. EUR/USD and GBP/USD had +0.84. Yet EUR/USD fell from 1.1555 to 1.1224 — 331 pips. GBP/USD fell from 1.3504 to 1.3459, only 45 pips.
On 0.1 lot that is about $331 against $45. On 0.01 lot it is $33 against $4.50. If pip values are new to you, start there. The correlation was right about direction. It promised nothing about the amount.
One day in the window
People search for correlation forex pairs tables as if the numbers were fixed. Old tables give EUR/USD and USD/CHF a correlation near −0.95. My three-month number is −0.59. Why so far apart? I recalculated it for every 20-day window. On 11 September the 20-day number was −0.94, the classic one. By 1 October it had moved to −0.69. A day later, on 2 October, it was −0.22.
One day did this. On 2 October the franc jumped against everything. The euro fell from 0.9437 to 0.9279 francs between two ECB fixings, and the press tied the move to French government debt. EUR/USD lost 0.65% that day and USD/CHF lost 1.04%. Both pairs fell together — and for a pair of opposites one such day is enough.
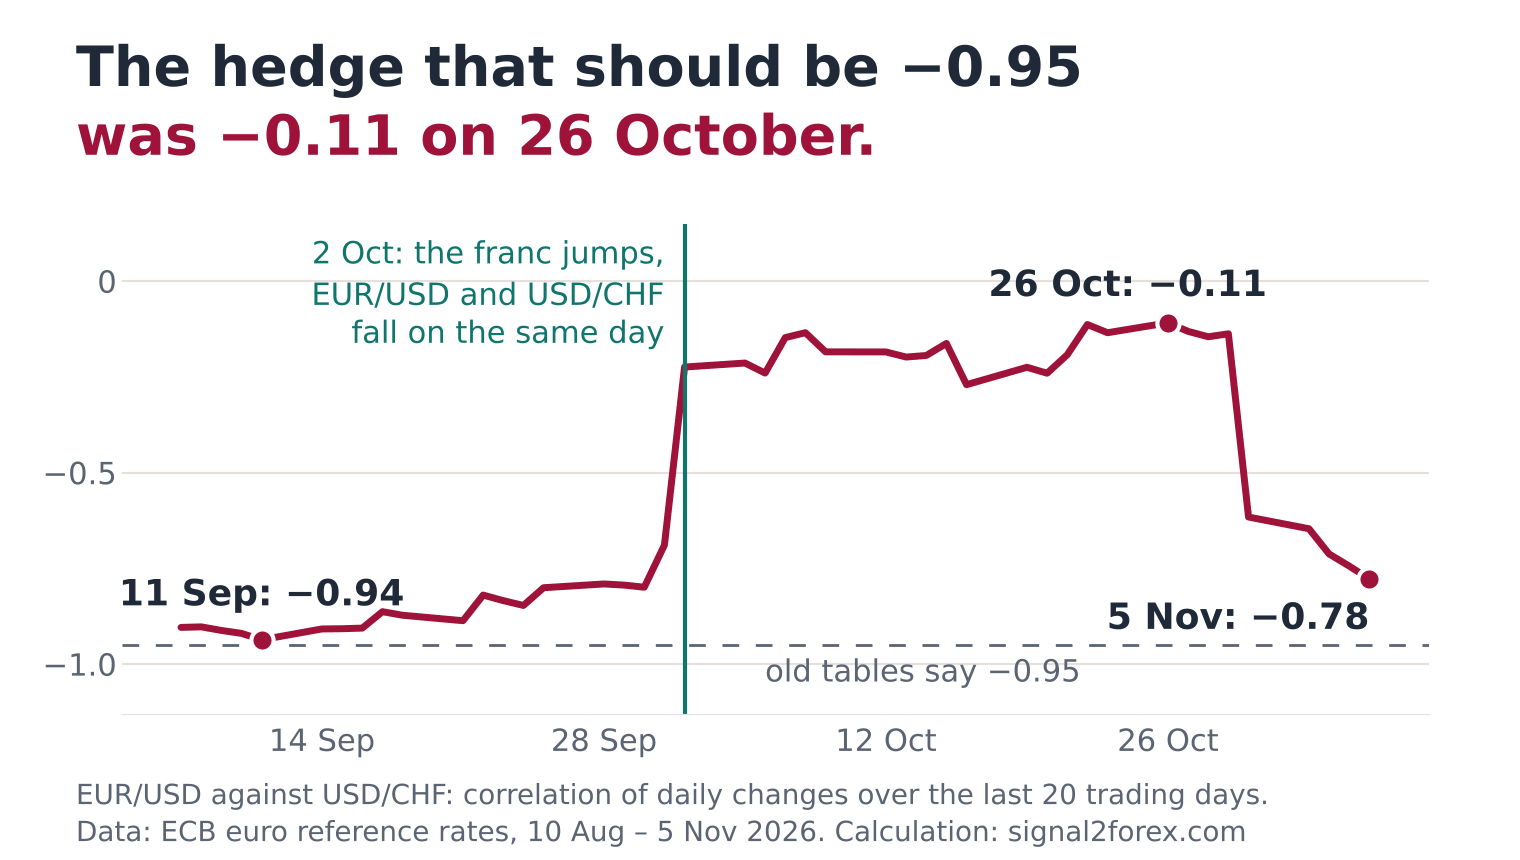
This is not only a story about the franc, but also about the tool. A 20-day window has a short memory and a loud voice. One unusual day sits inside it for exactly 20 trading days and then disappears. Days like this often start with a central bank — I wrote about that kind in hawkish vs dovish.
On 5 November the number was back at −0.78. I do not know whether it will hold there. One more day like 2 October and it breaks again.
Two trades as one
Now the part with money. Say each trade alone can lose $100 on a bad day — $1 on a cent account. What do two trades risk together? The simple sum says $200. The real answer depends on the correlation. It is the square root of 100² + 100² + 2 × correlation × 100 × 100.
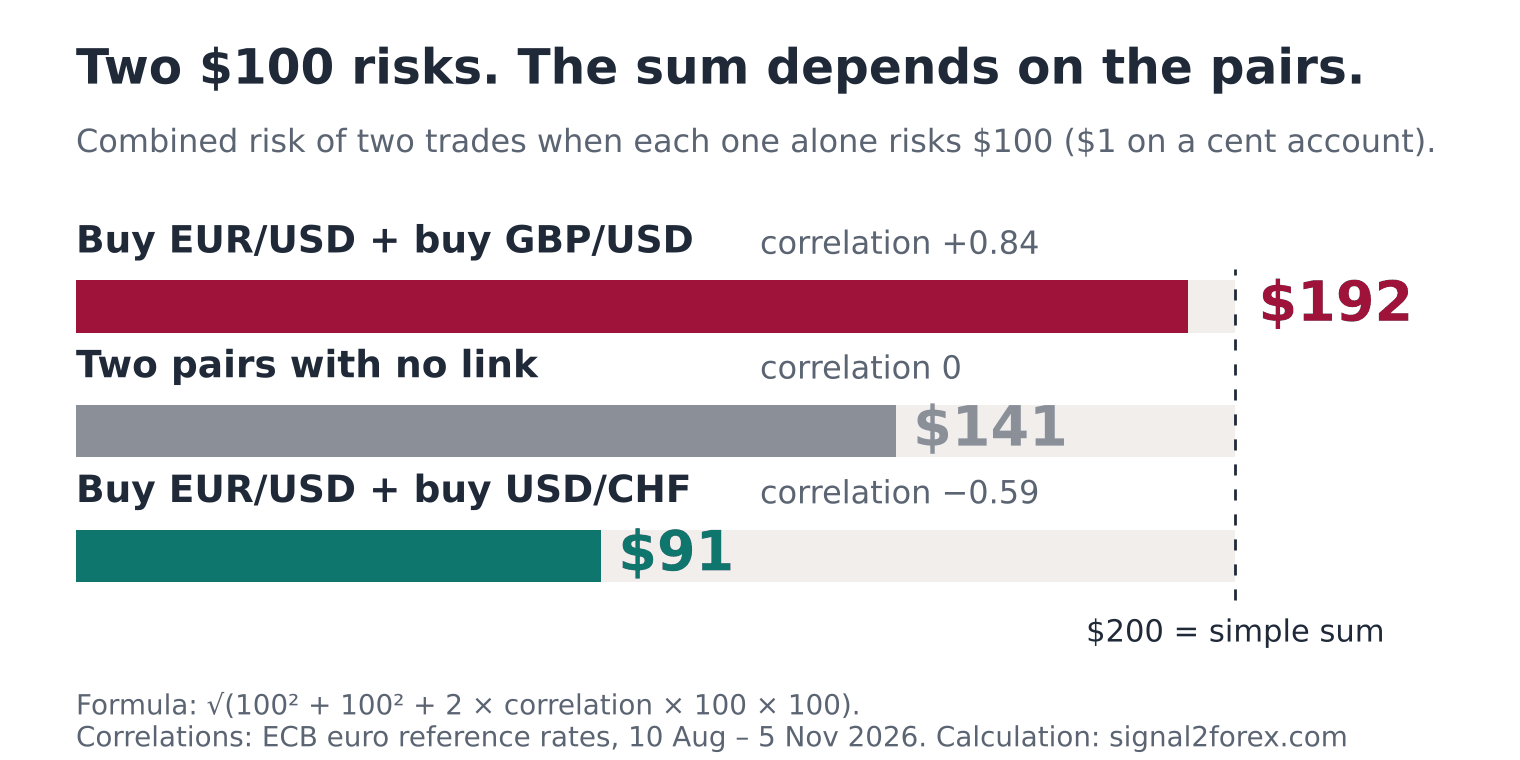
With EUR/USD and GBP/USD at +0.84 the result is $192. That is almost the full $200 — two tickets, one position. With two unrelated pairs it is $141. With a buy on EUR/USD and a buy on USD/CHF at −0.59 it is $91. If you plan to hold several correlated forex pairs, you need to do this sum before the second order.
A forex correlation strategy without a hedge
My forex correlation strategy is short. The first use is position size. Before a new order, look at what is already open. If the new pair has +0.7 or more with an open pair in the same direction, count both as one trade and split the lot between them.
The second use is confirmation. A signal on EUR/USD is stronger for me when GBP/USD shows the same picture on the same day. With +0.84 between them, a breakout on one pair alone is a reason to wait.
Most guides add the hedge. Buy EUR/USD, buy USD/CHF, and the loss on one pair is covered by the other. Does it work? I do not use it. Look at the sum above — at −0.59 the two trades risk $91 instead of $100. You pay two spreads and two swaps to remove $9 of risk. Half the lot on one pair does more and costs less. And on a day like 2 October the hedge loses on both legs.
A list of forex correlation pairs will not tell you that.
Fourteen pairs, eight currencies
One more thing, from my own work. Our Forex V Portfolio runs 28 robots on 14 pairs. Fourteen sounds like wide diversification. Is it? Then I counted the currencies — eight. The US dollar is in six of the 14 pairs, the Australian dollar in five, the euro and the Canadian dollar in four each.
So I ran the same calculation on all 14. That gives 91 pair combinations. Eight of them were at 0.7 or stronger — EUR/USD with GBP/USD at +0.84, CAD/JPY with USD/JPY at +0.80, AUD/CHF with EUR/AUD at −0.72.
Fifty-three were between −0.3 and +0.3. For me this is the argument for 14 pairs and not three — most of the combinations are weakly linked. The eight are where a move in one currency can reach two robots on the same day.
Correlation as a habit
The table at the top, the two groups around the dollar, the difference between prices and daily changes, the one day that sat in the window, the sum for two trades — all of this is one habit. Count currencies before you count pairs. Measure on fresh data and write the dates next to the number. The more of your open trades you can explain as separate bets, the steadier your account behaves on the day one currency moves.


 Signal2forex.com - Best Forex robots and signals


