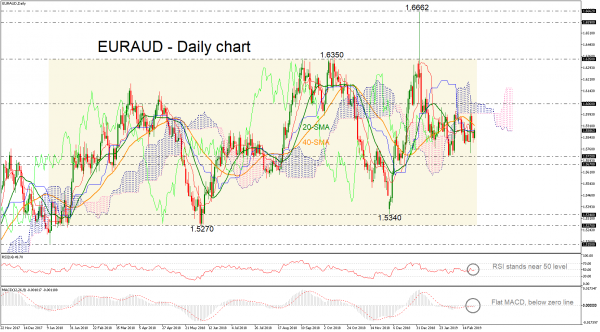
EURAUD has been moving sideways in the short-term and long-term timeframes. Over the last two-months, the price has been developing between the 1.6060 resistance level and the 1.5720 support barrier, trading near the 20- and 40-simple moving averages (SMAs) in the daily chart.
In addition, the red Tenkan-sen and the blue Kijun-sen lines are flattening, confirming the neutral structure. The market could maintain its consolidation mode as the RSI and the MACD are holding near their neutral levels with weak momentum.
An extension to the upside and above the Ichimoku cloud could meet the next resistance level of 1.6155, taken from the latest highs, while even higher, the upside rally could send the price towards the upper boundary of the long-term trading range near 1.6350, identified by the peaks on October 2018.
However, if the pair weakens, it could slip until the 1.5720 key level, before shifting the bias back to bearish and heading towards 1.5670. Even lower, the 1.5340 level could attract greater attention as any leg lower could worsen the market’s bearish outlook, opening the way towards the 1.5270 support area.
Regarding the long-term picture, the slight bullish sentiment deteriorated after the price failed to close above 1.6350, though it remains above 1.5270, underpinning the neutral picture.


 Signal2forex.com - Best Forex robots and signals


