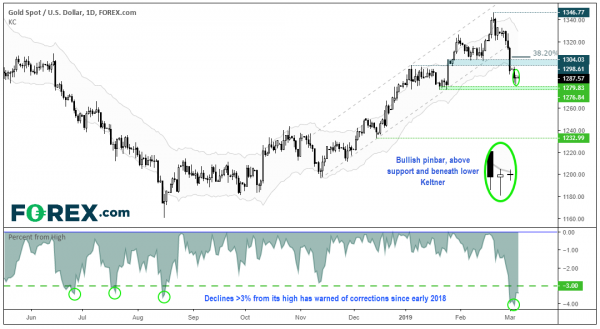
Gold’s decline since its multi-month high has not gone unnoticed, yet there are indications that mean reversion could soon be on the horizon.
Since August’s low, gold had gained increasingly bullish attention which saw it trade nicely within a tight bullish channel. That is, of course, until a bearish pinbar marked its high before rolling over and invalidating the channel. During this decline, momentum has been dominant on down-days and, as this appears to be the first wave or a correction, we see its potential for it to crash lower still. However, we suspect gold is in for a bounce higher before continuing lower.
Prices appear stretched to the downside, due to the small bullish hammer which trades beneath the lower Keltner band. Furthermore, its decline has exceeded a typical threshold associated with a bullish reversal, over recent history.
Using the lower indicator, which simply measures a % decline from a 10-bar high, we note several occasions where a decline of over 3% has warned of a correction or reversal. Having reached a 4% decline by Friday’s close and stopping just shy of support, a bounce appears the more likely.
Assuming stability is found above the 1276.84 low, bulls may look to trade this towards the 1298-1304 resistance zone, where a 38.2% Fibonacci level resides nearby. Bears on the other hand, may look to fade into such a zone, wait for bearish momentum to return beneath it, or seek a break of the 1276.84 low after prices have consolidated.


 Signal2forex.com - Best Forex robots and signals


