

A bullish hammer is the single-candle reversal signal Forex traders use to spot exhausted selling at the bottom of a downtrend — and this guide shows exactly how to confirm, enter and manage it on currency pairs.
A bullish hammer is a single-candle reversal pattern that forms at the bottom of a downtrend: a small real body, a lower wick at least twice the body length, and little or no upper wick. It shows buyers rejected lower prices. Forex traders wait for the next candle to close above the hammer’s high before going long, with a stop-loss below the hammer’s low.
IPA: /ˈbʊl.ɪʃ ˈhæm.ər/ · US: /ˈbʊl.ɪʃ ˈhæm.ɚ/
Synonyms: hammer candlestick · hammer pattern · bullish hammer reversal · hammer (bullish reversal)
Examples in sentences:
- “A bullish hammer printed on the EUR/USD daily chart at the 1.0500 support, and traders went long after the confirmation candle closed above its high.”
- “The bullish hammer that formed right after the Fed’s September 2024 rate cut carried extra weight because it aligned with the new easing bias.”
- “Its long lower wick proved the bullish hammer was real: sellers pushed the pair down but failed to hold the lows.”
📑 Table of Contents
1. Quick Definition: Bullish Hammer Candlestick
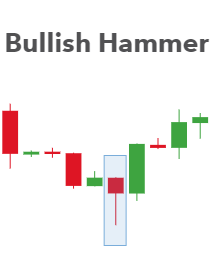
A bullish hammer candlestick is a one-candle bullish reversal pattern that appears at the bottom of a downtrend in a currency pair. Structure: small real body at the top of the range, lower wick ≥ 2× the body, little or no upper wick. The long lower wick is the footprint of buyers absorbing sell orders — the same mechanic that drives reversals after macro news on FX markets.
2. What Is a Bullish Hammer and Why It Works in Forex
During the session, sellers push the pair to new lows, but buyers aggressively defend the level and push the price back up to close near the high. This rejection of lower prices suggests bearish momentum is weakening and a reversal to the upside may be imminent. In Forex the signal is strongest where it coincides with institutional levels: round numbers, weekly support, 61.8–78.6% Fibonacci retracements, or a policy-driven reversal (see Section 6).
Key Characteristics
- Small real body — open and close are near each other, at the top of the range;
- Long lower wick — at least twice the length of the body;
- Little to no upper wick — the high is very close to the close;
- Location — must appear at the end of a clear downtrend;
- Colour — green or red; a green body adds extra confirmation.
3. How to Identify a Bullish Hammer on FX Charts
- Confirm the downtrend — at least 3–5 lower lows on the working timeframe (H4/D1 for majors).
- Check the wick ratio — lower wick ≥ 2× the real body.
- Check the upper wick — minimal; a long upper wick turns the candle into a spinning top (indecision).
- Check the level — a hammer in the middle of nowhere is noise; require support/Fib/round number.
- Wait for confirmation — the next candle must close above the hammer’s high before you buy.
Fig. 1 — Bullish hammer trade setup: downtrend → hammer → confirmation candle → entry/stop/target levels.
Common Mistakes
- Ignoring the trend — a hammer in an uptrend is just a candle, not a signal;
- No confirmation — entering on the hammer itself is the #1 beginner error;
- Trading news hammers — a hammer printed inside an FOMC/ECB spike is unreliable (Section 6);
- Trading every hammer — only those at key levels deserve risk.
4. Bullish Hammer vs. Hanging Man
The candles are visually identical; only the context differs:
- Bullish Hammer — bottom of a downtrend → bullish reversal;
- Hanging Man — top of an uptrend → bearish reversal.
Pro Tip: on currency pairs always check the preceding trend and the macro bias first. The same candle on EUR/USD can be a hammer in one week and a hanging man the next.
5. Bullish Hammer Forex Trading Strategy
Entry Points
- Breakout entry (recommended) — buy when the confirmation candle closes above the hammer’s high;
- Conservative entry — buy a retest of the confirmation candle’s high;
- Aggressive entry — buy at the open of the candle after confirmation (higher risk).
Stop-Loss Placement
- Standard — 5–10 pips plus spread below the hammer’s low (critical on FX: spreads widen at London open and news);
- Tight — below the confirmation candle’s low (noisy pairs like GBP/JPY will stop you out);
- Wide — below the recent swing low for volatile pairs (USD/JPY during BoJ weeks).
Profit Targets
- T1 — nearest swing high / resistance;
- T2 — 61.8% Fibonacci retracement of the downtrend;
- T3 — 100% retracement (start of the downtrend).
Confirmation Filters
- Bullish divergence on RSI/MACD;
- Hammer at support or 61.8–78.6% Fib;
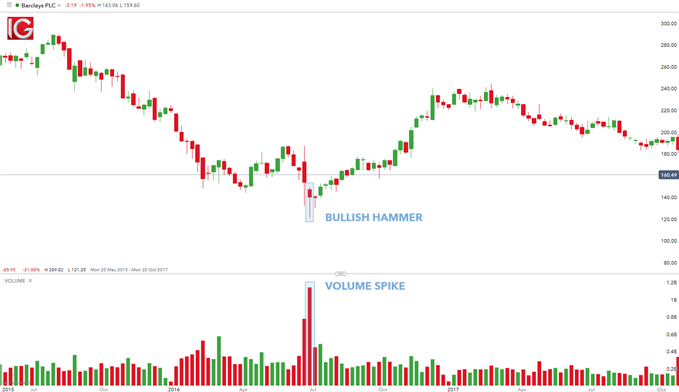
- Volume spike (use tick volume on FX);
- Touch of a rising 200 EMA.
6. Central Bank Decisions & Hammer Signals (Fed, ECB, BoE, BoJ)
Forex is a rates-driven market: with OTC FX turnover at $9.6 trillion per day in April 2025 (BIS Triennial Survey, 2025), policy decisions set the trend in which hammers either succeed or fail. Academic evidence also shows that raw candlestick signals are not profitable without filters and context — confirmation and trend alignment are what create value (Marshall, Young & Cahan, Journal of Banking & Finance, 2006; Lo, Mamaysky & Wang, NBER WP 7613).
Bottom line: a hammer aligned with the rate-differential trend is an A-grade signal; a hammer against an upcoming policy decision is a no-trade.
7. Forex Pre-Trade Checklist
- Downtrend confirmed on H4/D1 (3–5 lower lows);
- Hammer at support / 61.8–78.6% Fib / round number;
- Lower wick ≥ 2× body; upper wick minimal;
- Confirmation candle closed above the hammer’s high;
- No FOMC/ECB/BoE/BoJ decision or CPI within 60 minutes;
- Stop-loss = hammer low minus 5–10 pips plus spread;
- Risk ≤ 1–2% of equity; reward:risk ≥ 1:2 to T1;
- Traded during London/New York overlap for major-pair liquidity.
8. Bullish Hammer vs Other Reversal Patterns (Comparison Table)
| Feature | Bullish Hammer | Inverted Hammer | Morning Star | Bullish Engulfing |
|---|---|---|---|---|
| Number of Candles | 1 | 1 | 3 | 2 |
| Location | Bottom of downtrend | Bottom of downtrend | Bottom of downtrend | Bottom of downtrend |
| Body Size | Small | Small | Large (3rd candle) | Large (2nd candle) |
| Lower Wick | Long (≥2× body) | Short | Varies | Varies |
| Upper Wick | Short or none | Long (≥2× body) | Varies | Varies |
| Confirmation Needed | Yes (next candle) | Yes (next candle) | Yes (gap + candle) | Moderate |
| Best FX Context | Post-policy-decision reversals | Early reversal warning | Weekly chart bottoms | News-driven reversals |
| Reliability | High (with confirmation) | Medium-High | Very High | High |
📌 Reliability assumes trend alignment and confirmation; without them all patterns degrade (see Section 6 sources).
9. Best Timeframes for Hammer Patterns on Currency Pairs
| Timeframe | Reliability | Best Use | Signal Frequency |
|---|---|---|---|
| 1-Minute | Low | Not recommended | Very High |
| 5-Minute | Low-Medium | Scalping | High |
| 15-Minute | Medium | Day trading | Medium-High |
| 1-Hour | Medium-High | Intraday swing | Medium |
| 4-Hour | High | Swing trading majors | Low-Medium |
| Daily | Very High | Position trading | Low |
| Weekly | Very High | Long-term analysis | Very Low |
Fig. 2 — Editorial reliability scoring (0–100) by timeframe: signal-to-noise ratio improves as timeframe rises. Practitioner estimate, not a research statistic.
10. Real-World Example: Bullish Hammer on AUD/USD Daily
Scenario: AUD/USD fell from 0.6800 to 0.6450 over three weeks. A hammer with a 2.5× lower wick printed at the 61.8% Fib of the prior uptrend; the next day a strong bullish candle closed above the hammer’s high — confirmation.
Trade Setup:
- Entry: buy stop above the hammer’s high;
- Stop-Loss: 10 pips + spread below the hammer’s low;
- Target 1: swing high 0.6600; Target 2: 61.8% retracement at 0.6680.
Outcome: T1 hit in five days, T2 in two more weeks; risk-reward ≈ 1:3. The setup qualified because it also passed the macro filter: no RBA/Fed event inside the trade window.
11. Frequently Asked Questions
What does a bullish hammer mean in Forex?
In Forex, a bullish hammer means sellers failed to hold lower prices: the pair prints a long lower wick and closes near its high at the bottom of a downtrend. It warns that bearish momentum is weakening and a rally may begin after a confirmation candle.
How do you identify a bullish hammer candlestick?
Look for a small real body at the top of the range, a lower wick at least twice the body length, and little or no upper wick, appearing after a clear downtrend. On currency pairs, also require the confirmation candle to close above the hammer’s high before treating it as a buy signal.
Is a hammer candle bullish or bearish?
The same shape can be either. At the bottom of a downtrend it is a bullish hammer; at the top of an uptrend it is a hanging man (bearish). Context, not candle colour, decides the meaning on currency pairs.
What is the difference between a bullish hammer and a hanging man?
They are visually identical candles. A hammer forms at the bottom of a downtrend and signals a bullish reversal; a hanging man forms at the top of an uptrend and signals a bearish reversal.
Do I need a confirmation candle before buying a hammer on FX?
Yes. Enter only after the next candle closes above the hammer’s high. Without confirmation many hammers fail — academic studies of candlestick strategies show raw signals are not consistently profitable without filters and risk management.
Where should I place a stop-loss on a hammer on EUR/USD?
Place the stop 5–10 pips plus spread below the hammer’s low on EUR/USD. That level is where sellers failed; if price returns there, the reversal thesis is invalid.
Which timeframes work best for hammer patterns on currency pairs?
The H4, daily and weekly charts give the most reliable hammer signals on FX majors. M1–M15 hammers are mostly noise driven by algo flow and news spikes.
How do Fed and ECB rate decisions affect hammer signals?
Policy decisions set the dollar and euro trend for weeks. A hammer aligned with the policy trend (e.g., long EUR/USD during a Fed easing cycle) has better follow-through; a hammer into an upcoming FOMC or ECB decision is likely to be stopped out — check the central bank calendar first.
12. Sources & Primary Data
- Bank for International Settlements (2025). OTC foreign exchange turnover in April 2025 — $9.6 trillion/day. bis.org/statistics/rpfx25_fx.htm
- Board of Governors of the Federal Reserve System (2024). FOMC Statement, September 18, 2024. federalreserve.gov
- Board of Governors of the Federal Reserve System (2024). FOMC Statement, December 18, 2024. federalreserve.gov
- European Central Bank. Key ECB interest rates. ecb.europa.eu
- Bank of England. Monetary Policy. bankofengland.co.uk
- Bank of Japan. Monetary Policy. boj.or.jp
- Marshall, B.R., Young, M.R., Cahan, R. (2006). Candlestick technical trading strategies: Can they create value for investors? Journal of Banking & Finance, 30(8), 2303–2323. sciencedirect.com
- Lo, A.W., Mamaysky, H., Wang, J. (2000). Foundations of Technical Analysis. NBER Working Paper No. 7613. nber.org



 Signal2forex.com - Best Forex robots and signals


