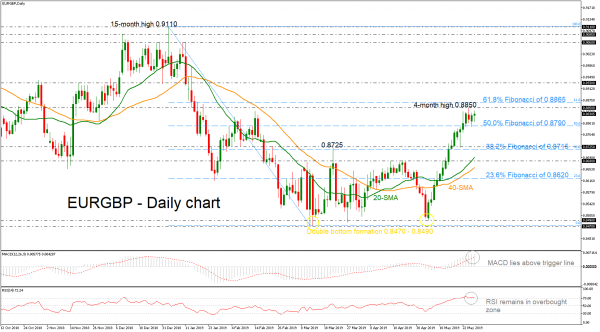
EURGBP has advanced considerably around a fresh four-month high of 0.8850 in the previous couple of days following the creation of a double bottom formation around 0.8470 and 0.8490. The aggressive bullish run has led the price to pare some of the losses posted from the downfall from 0.9110 to 0.8470.
Looking at momentum oscillators on the daily chart, they suggest further increases may be on the cards in the short-term. The RSI is above its overbought 70 line, while the MACD, already positive, lies above its trigger line.
If the market manages to pick up speed above the four-month peak, the 61.8% Fibonacci mark of 0.8865 could offer nearby resistance. A violation of this barrier could confirm a strong upside rally until the 0.8930 area, identified by the inside swing bottom of December 2018.
Should prices decline, immediate support could be found around the 50.0% Fibonacci of 0.8790 an area which has provided both resistance and support since January. Then a leg below that level, the pair could meet the 0.8725 region and the 38.2% Fibonacci of 0.8715.
In the short-term, the outlook remains positive since prices recorded a double bottom pattern and hold above all the moving average lines.


 Signal2forex.com - Best Forex robots and signals


