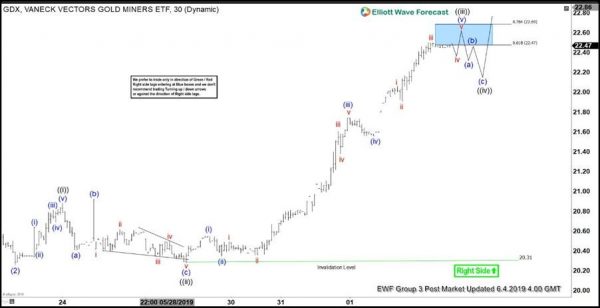
Elliott wave view in Gold Miners ETF ($GDX) suggests the pullback to $20.26 ended wave (2). Wave (3) is currently in progress and the internal subdivides as an impulse Elliott Wave structure. Up from $20.26, Wave ((i)) ended at $20.88, wave ((ii)) ended at $20.31 and wave ((iii)) can end soon at $22.47 – $22.69 area. It should then pullback in 3, 7, or 11 swing within wave ((iv)) to correct rally from May 29 low before the rally resumes again in wave ((v)).
We can see from the chart below the internal of wave ((i)) and ((iii)) also subdivide as an impulse in lesser degree. The internal of wave ((ii)) subdivides as an expanded Flat Elliott Wave structure. Potential target for wave ((iv)) is 23.6 – 38.2 Fibonacci retracement of wave ((iii)). In order to measure wave ((iv)) potential support area, we need to see wave ((iii)) fully completed first. We don’t like selling $GDX and expect buyers to appear in 3, 7, or 11 swing as far as pivot at $20.31 low stays intact. In larger time frame, if $GDX can break above Feb 21 peak ($23.70), then it should create a bullish sequence from Sept 11, 2018 low opening up more upside.


 Signal2forex.com - Best Forex robots and signals


