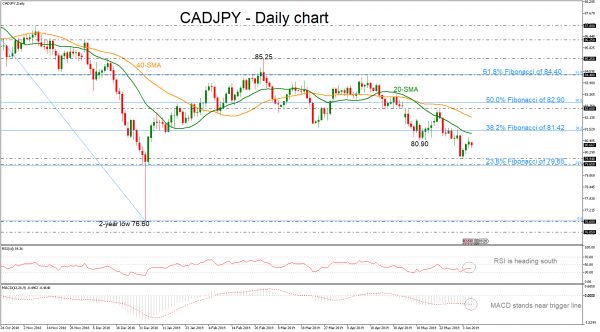
CADJPY has been finding strong resistance on the 38.2% Fibonacci retracement level of the downward wave from 89.25 to 76.60, near 81.42, falling beneath the 20-simple moving average (SMA) in the daily chart. Having a look at the momentum indicators, the RSI is sloping down below the neutral threshold of 50 and the MACD is hovering near the trigger line and below the zero line.
A step lower could find immediate support at the 79.94 support and the 23.6% Fibonacci of 79.65. More downside pressures could drive the pair towards the two-year low of 76.60, taken from the bottom on January 3.
An advance above the 38.2% Fibonacci of 81.42 and the 20-day moving average could open the door for bullish actions until the 40-SMA of 82.13 and the 82.60 resistance. If there is a successful jump above the 50.0% Fibonacci of 82.90, prices could challenge again the significant 61.8% Fibonacci of 84.40.
However, a break below the 23.6% Fibonacci of 76.65 could confirm the long-term negative momentum.
Signal2forex reviews
 Signal2forex.com - Best Forex robots and signals


