Bearish Engulfing Pattern — Complete Trading Guide for Forex (2026)
The bearish engulfing candle is one of the forex market’s most clear-cut price action signals. This guide explains what it is, how to identify it, how to trade it with indicators and support/resistance, and how to set entry, stop-loss, and take-profit levels — plus a comprehensive reference table and a static trade checklist to help you plan your trades.
1. What Is a Bearish Engulfing Pattern?
A bearish engulfing pattern is a two-candle candlestick pattern that forms at the top of an uptrend and signals a potential bearish reversal. It consists of a small bullish (green/white) candle followed by a large bearish (red/black) candle that completely engulfs the body of the previous candle.
📌 Key Definition: A bearish engulfing pattern produces the strongest signal when it appears at the end of an uptrend. The pattern is created by interpreting the data of two completed candles.
The pattern reflects a dramatic shift in market sentiment: buyers were in control, but sellers overwhelmed them and pushed the price down below the previous candle’s low. This strong downward movement reflects sellers overtaking buying strength and often precedes a continued fall in price.
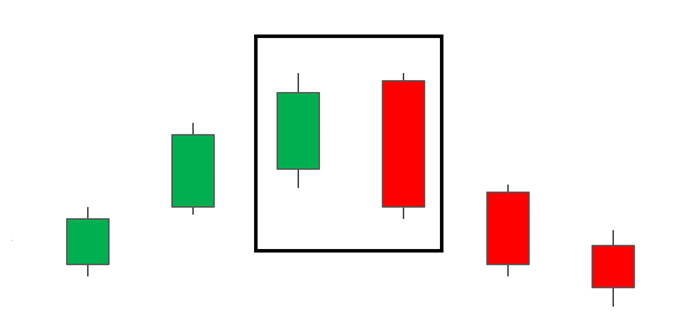
Fig 1: Bearish engulfing pattern forming at the top of an uptrend — a clear reversal signal.
Key Characteristics of the Pattern
- First candle: Small bullish candle (green/white) — represents the end of the uptrend. Dojis and other small bullish candles provide the strongest signal as they can reflect market indecision.
- Second candle: Large bearish candle (red/black) — opens above the close of the previous candle and closes well below the low of the previous candle.
- Location: Must appear at the top of an uptrend or near resistance.
- Signal strength: The further the bearish candle declines, the stronger the signal becomes.
The Psychology Behind the Pattern
- Buyers push price higher (first candle).
- Sellers aggressively enter the market (second candle opens higher).
- Sellers drive price down below the first candle’s low (second candle closes lower).
- This shows that selling pressure has overcome buying pressure.
2. Bearish vs Bullish Engulfing — Key Differences
Engulfing patterns can be bullish and bearish. The bullish engulfing pattern is essentially the opposite of the bearish engulfing pattern. Instead of appearing in an uptrend, it appears at the bottom of a downtrend and presents traders with a signal to go long.
| Aspect | Bearish Engulfing | Bullish Engulfing |
|---|---|---|
| First Candle | Small bullish (green/white) | Small bearish (red/black) |
| Second Candle | Large bearish (red/black) engulfs first | Large bullish (green/white) engulfs first |
| Location | Top of an uptrend | Bottom of a downtrend |
| Signal | Bearish reversal | Bullish reversal |
| Action | Consider short positions | Consider long positions |
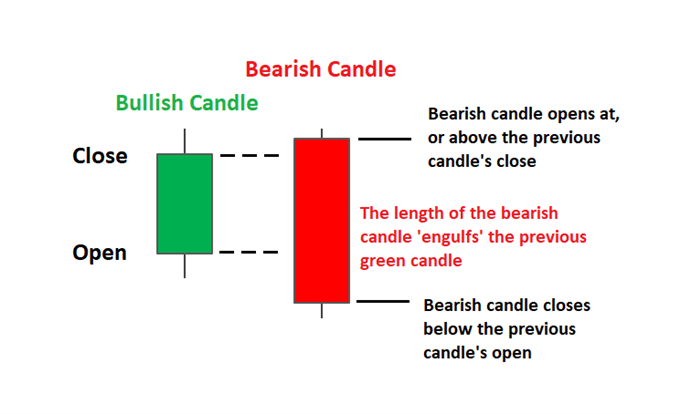
Fig 2: Comparison of bearish engulfing (top of uptrend) and bullish engulfing (bottom of downtrend).
3. Trading the Bearish Engulfing Candle Using Indicators
Traders should always be on the lookout for trade confirmation by utilizing indicators, key levels of support and resistance, or any other technique that will support or invalidate a trade.
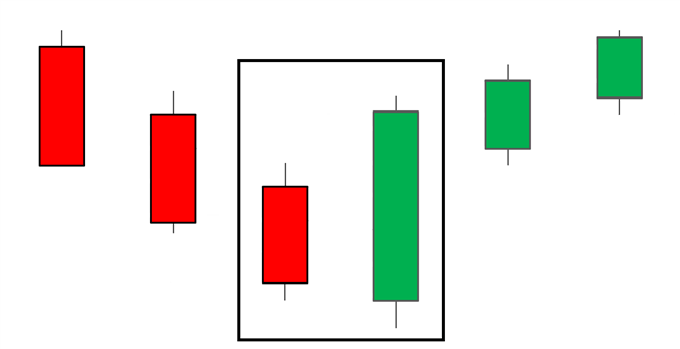
Fig 3: Bearish engulfing pattern at the top of an uptrend on EUR/USD daily chart with RSI overbought confirmation.
The example above highlights the bearish engulfing pattern appearing at the top of the uptrend on the EUR/USD daily chart. The chart shows the Euro appreciating and topping out where the bearish engulfing pattern appears. Additionally, the Relative Strength Indicator (RSI) validates the bearish bias with an overbought signal.
📌 Key Insight: While it is not advisable to trade against the trend, in reality, reversals do occur, which is why all traders should be able to spot when this is likely to appear.
Taking a closer look at the chart, entry levels, stops, and targets can be identified. The RSI overbought condition (above 70) provides additional confidence that the bearish reversal may be valid.
4. Trading the Bearish Engulfing Candle Using Support & Resistance

Fig 4: Bearish engulfing pattern appearing at resistance on the US Dollar Index (DXY).
The chart above shows a bearish engulfing candle pattern appearing at resistance on the US Dollar Index (DXY). The level of support is important here because it shows that movements higher have been rejected previously.
When the bearish engulfing pattern appears at resistance, it provides greater conviction towards a bearish bias. The level of resistance reinforces the signal because it shows that price has been rejected at this level previously.
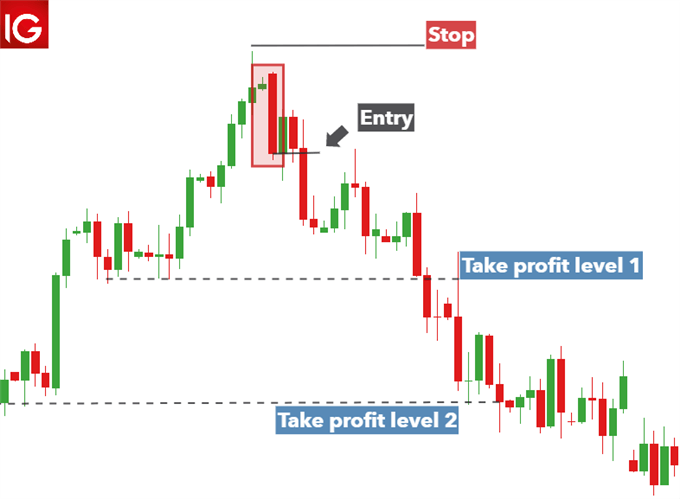
Fig 5: Bearish engulfing pattern with entry, stop-loss and take-profit levels clearly marked.
5. Entry, Stop-Loss and Take-Profit Levels
Below is a summary of how to set entry, stop-loss, and take-profit levels when trading the bearish engulfing pattern.
| Element | Strategy with Indicators | Strategy with Support/Resistance |
|---|---|---|
| Entry | Wait for a close lower than the low of the bearish candle, or place working orders far below the low | Enter at the open of the following candle |
| Stop-Loss | Place above the recent swing high (this would invalidate the move and provides a sensible risk-to-reward ratio) | Place above the bearish engulfing candle and the level of resistance |
| Take-Profit | Consider an initial take-profit level at recent support, while remaining open to further downward movement | Set targets at a recent level of support; consider a second target level or trailing stop |
| Risk/Reward | Aim for at least 1:2 or better | Aim for at least 1:2 or better |
💡 Pro Tip: Since bearish engulfing candles can indicate the beginning of a prolonged downtrend, it is helpful to consider an initial take-profit level while remaining open to further downward movement. Adjust stops accordingly or consider using a trailing stop.

Fig 6: Complete bearish engulfing trade setup — entry, stop-loss and take-profit levels.
6. Bearish Engulfing Pattern Reference Table
Use this reference table to quickly identify and trade the bearish engulfing pattern.
Bearish Engulfing Pattern Reference
7. Bearish Engulfing Trading Checklist
Use this checklist before entering any trade based on the bearish engulfing pattern to ensure you’ve covered all the key criteria.
Pre-Trade Checklist
📌 Pro Tip: Print this checklist or keep it handy when analysing charts. A systematic approach to trade validation can significantly improve your trading consistency.
8. Frequently Asked Questions (FAQ)
What is a bearish engulfing pattern?
A bearish engulfing pattern is a two-candle reversal pattern that forms at the top of an uptrend. It consists of a small bullish candle followed by a large bearish candle that completely engulfs the first candle’s body. It signals that selling pressure has overcome buying pressure.
How do I identify a bearish engulfing pattern?
Look for: (1) An uptrend, (2) A small bullish candle, (3) A large bearish candle that opens above the previous close and closes below the previous low, (4) The bearish candle completely engulfs the body of the first candle. The pattern is strongest when it appears at resistance or with RSI overbought confirmation.
What is the difference between bearish and bullish engulfing?
Bearish engulfing appears at the top of an uptrend and signals a bearish reversal (red candle engulfs green). Bullish engulfing appears at the bottom of a downtrend and signals a bullish reversal (green candle engulfs red). They are opposites.
Where should I place my stop-loss with a bearish engulfing pattern?
Place your stop-loss above the recent swing high or above the high of the bearish candle. When trading at resistance, place the stop-loss above the resistance level. This would invalidate the bearish move.
What is the best confirmation for a bearish engulfing pattern?
The best confirmations are: (1) RSI showing overbought conditions (above 70), (2) Pattern appearing at a key resistance level, (3) Bearish divergence on momentum indicators, (4) The bearish candle closing with strong volume.
Can I trade the bearish engulfing pattern on any timeframe?
Yes. The pattern works on all timeframes. Day traders often use 15-minute or 1-hour charts, while swing traders prefer 4-hour or daily charts. The principles are the same across all timeframes.
What risk-to-reward ratio should I aim for?
Aim for a minimum risk-to-reward ratio of 1:2. This means your potential profit should be at least twice your potential loss. Higher ratios (1:3 or more) provide even better trading opportunities.
9. Conclusion
The bearish engulfing pattern is one of the most reliable price action signals in forex trading. When identified correctly — at the top of an uptrend, with confirmation from indicators or key levels — it can provide high-probability reversal trading opportunities.
Key takeaways:
- ✅ The bearish engulfing pattern consists of a small bullish candle followed by a large bearish candle that engulfs it
- ✅ It signals a bearish reversal at the top of an uptrend
- ✅ Confirmation from RSI (overbought) or resistance levels increases signal strength
- ✅ Place your stop-loss above the recent swing high or resistance level
- ✅ Aim for a risk-to-reward ratio of 1:2 or better
- ✅ Use the reference table and checklist above to validate your trades
📌 Final Advice: While the bearish engulfing pattern is a powerful signal, it should never be used in isolation. Always combine it with technical analysis, risk management, and proper position sizing for consistent trading success.
Continue your trading education — explore the guides below to deepen your understanding of risk management and other powerful candlestick patterns.
Updated: June 2026
 Signal2forex.com - Best Forex robots and signals


