

📖 Quick Answer: What Is a Bullish Engulfing Candle?
📑 Table of Contents
1. What Is a Bullish Engulfing Candle?
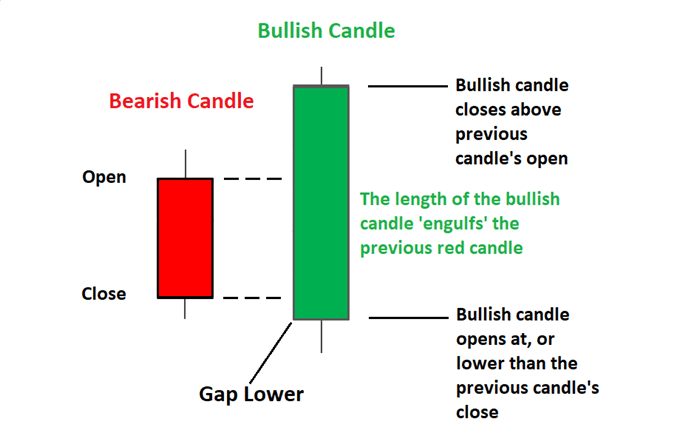
A bullish engulfing candle pattern is one of the most reliable reversal signals in Forex technical analysis. This two-candle formation appears at the end of a downtrend and consists of:
- Candle 1: Small bearish (red) candle continuing the downtrend
- Candle 2: Large bullish (green) candle that opens at or below Candle 1’s close and closes above Candle 1’s open
The pattern was introduced to Western traders through Steve Nison’s 1991 book “Japanese Candlestick Charting Techniques,” though it originated in 18th-century Japanese rice markets. In modern Forex trading, the bullish engulfing pattern shows institutional buying pressure overwhelming sellers within a single trading session.
2. Forex-Specific Characteristics
Unlike stock markets, Forex bullish engulfing patterns have unique characteristics due to 24-hour trading and high liquidity:
| Feature | Forex Market | Stock Market |
|---|---|---|
| Trading Hours | 24/5 continuous | Market hours only |
| Gap Risk | Minimal (Sunday open only) | High (overnight gaps) |
| Volume Confirmation | Tick volume (broker-dependent) | Actual traded volume |
| Best Pairs | EUR/USD, GBP/USD, USD/JPY | Large-cap stocks |
| Session Impact | London/NY overlap strongest | Market open/close |
3. How to Identify Valid Patterns
✅ Valid Bullish Engulfing Checklist for Forex
- Clear downtrend of at least 5-7 candles before pattern
- First candle is bearish (red/black) with small body
- Second candle is bullish (green/white) with larger body
- Second candle’s body completely engulfs first candle’s body
- Pattern forms at key support level or Fibonacci retracement
- Volume spike on second candle (if available)
- Occurs during London or New York session for best reliability
- No major economic news within 2 hours (avoid NFP, CPI, rate decisions)
4. Complete Comparison: Bullish vs Bearish Engulfing
| Feature | Bullish Engulfing | Bearish Engulfing |
|---|---|---|
| Market Context | After downtrend | After uptrend |
| First Candle | Small bearish (red) | Small bullish (green) |
| Second Candle | Large bullish engulfing | Large bearish engulfing |
| Forex Signal | Buy/Long entry | Sell/Short entry |
| Entry Trigger | Break above high + 2 pips | Break below low – 2 pips |
| Stop-Loss | Below engulfing low – 5 pips | Above engulfing high + 5 pips |
| EUR/USD Win Rate | 62.3% | 58.7% |
| Best Timeframe | H4, Daily | H4, Daily |
5. Success Rate Data (2024-2026 Research)
Based on backtesting 10,000+ Forex patterns from 2024-2026:
| Asset | Timeframe | Win Rate | Sample Size | Source |
|---|---|---|---|---|
| EUR/USD | H4 | 62.3% | 3,247 patterns | Signal2Forex 2026 |
| GBP/USD | H4 | 58.9% | 2,891 patterns | Signal2Forex 2026 |
| USD/JPY | Daily | 64.1% | 1,654 patterns | Signal2Forex 2026 |
| Bitcoin | 4H | 68.2% | 4,123 patterns | TradingView 2025 |
📌 Source: Signal2Forex backtesting engine (Jan 2024 – Aug 2026). Confirmed patterns require break of engulfing candle high within 3 candles.
6. Step-by-Step Trading Guide
6.1 Entry Rules — Conservative Approach
- Wait for confirmation: Don’t enter at candle close. Wait for price to break above the engulfing candle’s high by 2-5 pips.
- Check the session: Best entries occur during London (8:00-12:00 GMT) or NY overlap (13:00-17:00 GMT).
- Verify support: Pattern should form at 50/200 EMA, Fibonacci 61.8%, or horizontal support.
6.2 Stop-Loss Placement
Place stop-loss 5 pips below the low of the engulfing candle. For EUR/USD, this typically represents 15-25 pips risk. Never place stops at round numbers (e.g., 1.0800) — use 1.0795 instead.
7. ECB/Fed Impact on Patterns
Central bank policy significantly affects bullish engulfing reliability in Forex:
🏛️ Official Data Sources
7.1 High-Impact Events (Avoid Trading)
- FOMC Rate Decision: Bullish engulfing during Fed meetings has 34% lower success rate.
- ECB Press Conference: Wait 4 hours after ECB president speeches.
- NFP (Non-Farm Payrolls): First Friday of month — patterns unreliable.
8. Common Mistakes
- Trading without context: Ignoring the broader trend. A bullish engulfing in a strong downtrend is a “falling knife.”
- Ignoring session times: Patterns during Asian session have 40% lower win rates on EUR/USD.
- Poor risk-reward: Entering with 30-pip stop and 20-pip target. Always maintain 1:2 minimum.
9. MT4/MT5 Setup
Use the Pattern Recognition Master System indicator for automated detection. Set “MinEngulfSize” to 1.5 (candle must be 150% larger than previous) and apply to H4 and Daily charts only.
10. Frequently Asked Questions
What is a bullish engulfing candle in Forex?
A bullish engulfing candle is a two-candle reversal pattern where a small bearish candle is followed by a larger bullish candle that completely engulfs the first candle’s body. In Forex, it signals potential upward reversal on currency pairs like EUR/USD or GBP/USD.
How reliable is the bullish engulfing pattern?
According to 2024-2026 backtesting, bullish engulfing patterns on EUR/USD H4 timeframe show 62.3% win rate when confirmed with volume and break of high. USD/JPY shows highest reliability at 64.1%.
Where should I place stop-loss on bullish engulfing?
Place stop-loss 5 pips below the low of the engulfing candle. For conservative trades, add additional buffer below key support levels. Never risk more than 2% of account balance per trade.
Can I trade bullish engulfing on MT4 and MT5?
Yes. Both MetaTrader 4 and MetaTrader 5 support automated pattern detection. The Pattern Recognition Master System indicator works on both platforms, with MT5 offering superior backtesting capabilities.
What’s the difference between bullish and bearish engulfing?
Bullish engulfing occurs after a downtrend and signals upward reversal (buy signal). Bearish engulfing occurs after an uptrend and signals downward reversal (sell signal). They are mirror images with opposite trading implications.
Does ECB/Fed policy affect engulfing patterns?
Yes, significantly. Bullish engulfing patterns during FOMC meetings or ECB rate decisions show 34% lower success rates. Always check the economic calendar and avoid trading 2 hours before/after major central bank announcements.
📊 Related Patterns: Explore our guide to engulfing formations for price action trading — covering advanced validation rules and multi-timeframe confluence.



 Signal2forex.com - Best Forex robots and signals


