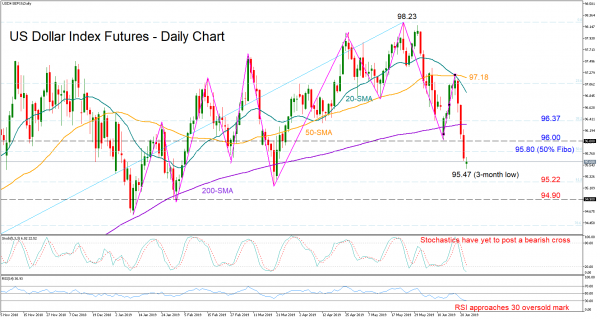
The position in the US dollar index futures is on the back foot for the fourth consecutive day and near a three-month low of 95.47 following the rejection from the 20- and the 50-day simple moving averages (SMA).
The price has so far fallen below the 200-day SMA, the previous low of 96 and the 50% Fibonacci of the 93.56-98.23 upleg, putting the January upward pattern into question.
In the short-term, downside pressure may persist but potentially at a softer pace given that Stochastics and the RSI are entering the oversold territory.
Should the market fail to clear the 95.80-96.00 area, bearish pressure may intensify, sending the price towards the 61.8% Fibonacci of 95.22. In case of a sharper decline, the 94.90 level could provide support as well, as it did in January.
A closing price above the 96 number would bring the 200-day SMA and the 38.2% Fibonacci of 96.37 into view. Nevertheless, a rally above the 50-day SMA currently at 97.18 may likely prove more valuable to the market.
In the three-month picture, the dollar index is in a range, fluctuating between 98.23 and 95.14.


 Signal2forex.com - Best Forex robots and signals


